. 2011 Nov 8;10(1):Article 52.
doi: 10.2202/1544-6115.1732.

Modeling read counts for CNV detection in exome sequencing data

Affiliations

Modeling read counts for CNV detection in exome sequencing data

Michael I Love et al. Stat Appl Genet Mol Biol. .

Abstract

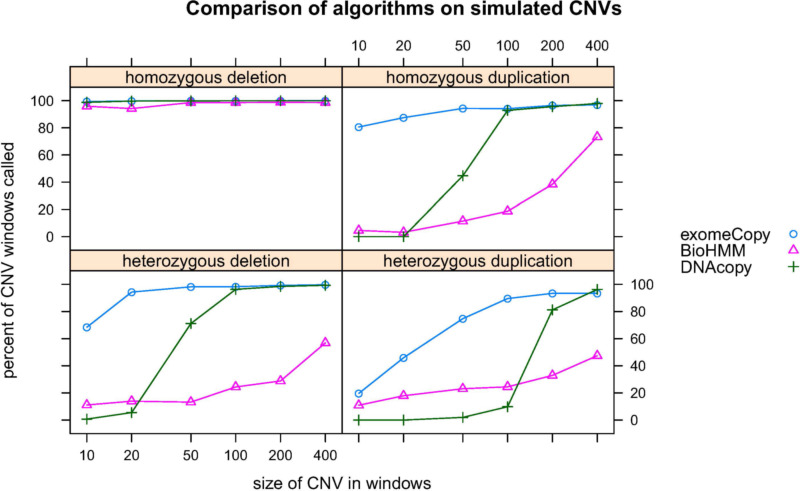
Varying depth of high-throughput sequencing reads along a chromosome makes it possible to observe copy number variants (CNVs) in a sample relative to a reference. In exome and other targeted sequencing projects, technical factors increase variation in read depth while reducing the number of observed locations, adding difficulty to the problem of identifying CNVs. We present a hidden Markov model for detecting CNVs from raw read count data, using background read depth from a control set as well as other positional covariates such as GC-content. The model, exomeCopy, is applied to a large chromosome X exome sequencing project identifying a list of large unique CNVs. CNVs predicted by the model and experimentally validated are then recovered using a cross-platform control set from publicly available exome sequencing data. Simulations show high sensitivity for detecting heterozygous and homozygous CNVs, outperforming normalization and state-of-the-art segmentation methods.


Figures

None
Figure 1: Distribution of read counts in windows covering the CCDS regions of chromosome 1 for one exome sequencing sample, cropped at 100 reads per window.
None
Figure 2: Mean and variance of read count for 23,619 windows over 40 samples with similar amount of total mapped reads.
None
Figure 3: Boxplots of read counts for 5 samples over windows covering exons of chromosome 1.
None
Figure 4: Sample-normalized read counts for 15 consecutive windows over 200 samples.
None
Figure 5: Smooth scatterplot of median read depth over GC-content. Median read depth is the median of sample-normalized read counts from 200 samples.
None
Figure 6: Transition probabilities for copy number states of the HMM with {Si} = {0,1,2,3,4} and expected copy number d = 2.
None
Figure 7: Experimentally validated CNVs identified in the XLID read depth data. The y-axis corresponds to the raw read counts for windows along the targeted region. The x-axis corresponds to the index of the windows. The color is the predicted copy number with blue indicating a hemizygous duplication and red indicating a hemizygous deletion.
None
Figure 8: XLID median normalized read depth and Danish exome median normalized read depth. Between groups there is positive but not strong Pearson correlation, while randomly dividing groups and comparing median read depth within groups gives very high correlation.
None
Figure 9: exomeCopy and exomeCopyVar perform similarly in recovering simulated CNVs of different type and size. Average percent of windows called CNV outside of the simulated CNVs is 0.5% and 0.8% and average run time is 7.6 s and 10.3 s for exomeCopy, exomeCopyVar respectively. Each point is the average over 100 simulations.
None
Figure 10: Performance of algorithms in recovering simulated CNVs on chr 1 of the Danish exome samples. exomeCopy is equally or more sensitive for almost all types and sizes of CNVs. Average percent of windows called CNV outside of the simulated CNVs is 0.4%, 5.2%, 0.2% and average run time is 7.4 s, 111.9 s, 3.7 s for exomeCopy, BioHMM, and DNAcopy respectively. Each point is the average over 100 simulations.
None
Figure 11: Relaxed evaluation of algorithms in recovering simulated CNVs on chr 1 of the Danish exome samples. The same simulations as in Figure 10 are presented, but evaluation ignores the difference between heterozygous and homozygous predicted CNVs. BioHMM has improved recovery of small homozygous duplications and heterozygous deletions.
None
Figure 12: Effect of background correlation on the absolute value of fitted coefficients. The x-axis shows the correlation of the simulated background with the original Danish background. Each point is the average over 100 simulations.
None
Figure 13: Performance of algorithms in recovering simulated CNVs on chr 1 after subsampling reads from the high coverage 1000 Genomes exome sequencing data. exomeCopy is increasingly sensitive with increasing average read counts. Average percent of windows called CNV outside of the simulated CNVs is always less than 0.7%. Each point is the average over 100 simulations.

References

    1. 1000 Genomes Project Consortium (2010): “A map of human genome variation from population-scale sequencing,” Nature, 467, 1061–1073. - PMC - PubMed
    1. Alkan, C., J. M. Kidd, T. Marques-Bonet, G. Aksay, F. Antonacci, F. Hormozdiari, J. O. Kitzman, C. Baker, M. Malig, O. Mutlu, S. C. Sahinalp, R. A. Gibbs, and E. E. Eichler (2009): “Personalized copy number and segmental duplication maps using next-generation sequencing,” Nature Genetics, 41, 1061–1067. - PMC - PubMed
    1. Anders, S. and W. Huber (2010): “Differential expression analysis for sequence count data.” Genome biology, 11, R106+. - PMC - PubMed
    1. Benjamini, Y. and T. P. Speed (2011): “Estimation and correction for GC-content bias in high throughput sequencing,” Technical report, University of California at Berkeley.
    1. Bliss, C. I. and R. A. Fisher (1953): “Fitting the Negative Binomial Distribution to Biological Data,” Biometrics, 9.

Publication types