. 2013 Jan;12(1):158-71.
doi: 10.1074/mcp.M112.023614. Epub 2012 Oct 22.

Quantification of the N-glycosylated secretome by super-SILAC during breast cancer progression and in human blood samples

Affiliations

Quantification of the N-glycosylated secretome by super-SILAC during breast cancer progression and in human blood samples

Paul J Boersema et al. Mol Cell Proteomics. 2013 Jan.

Abstract

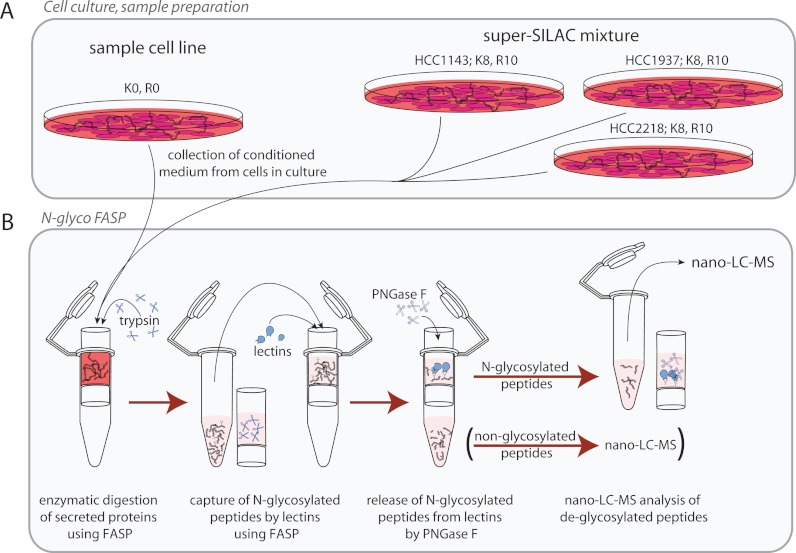
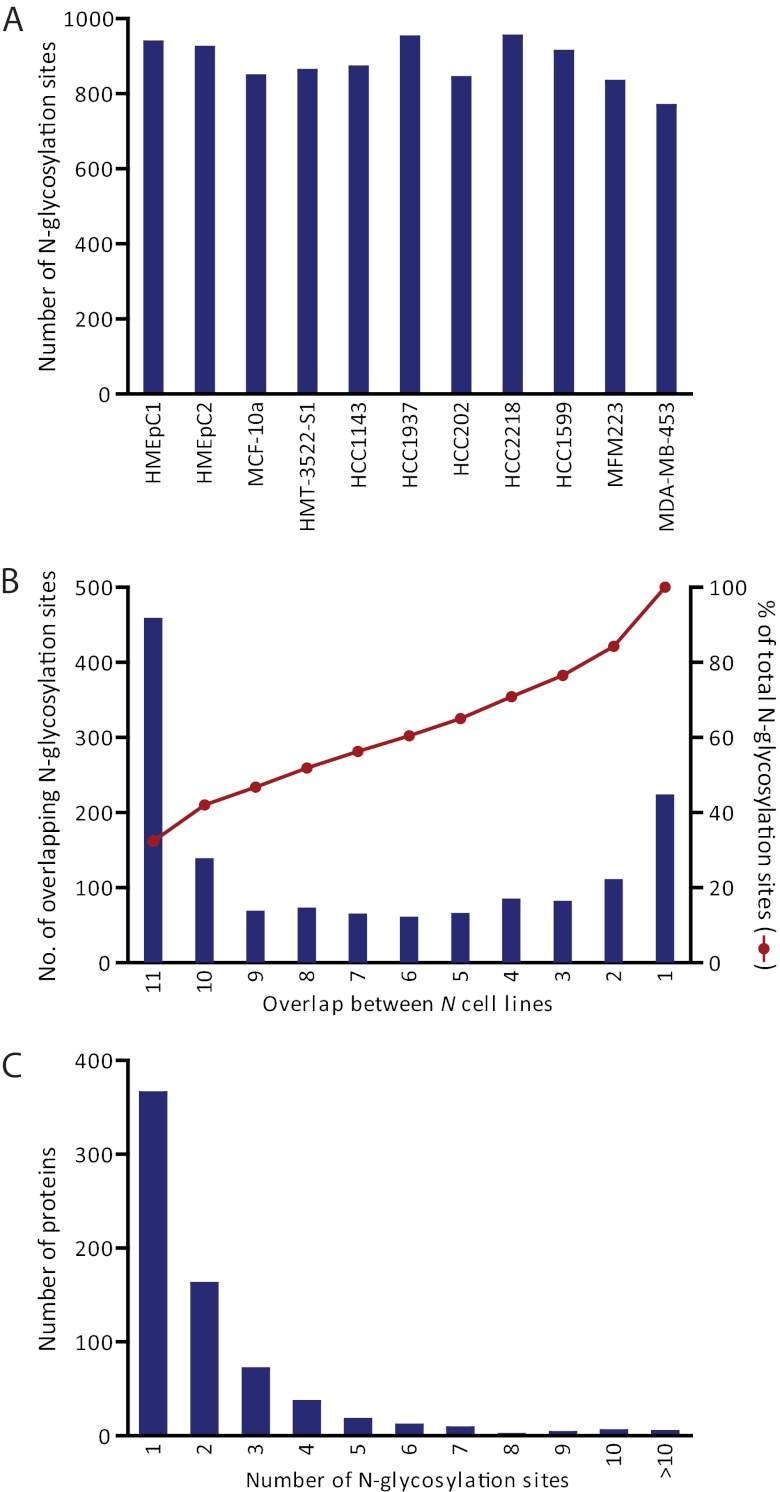
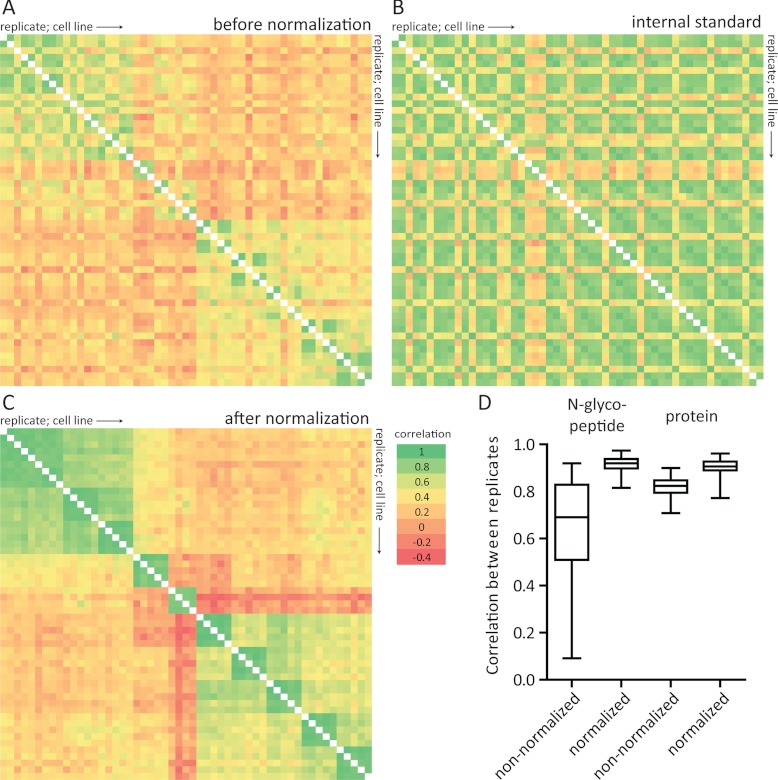
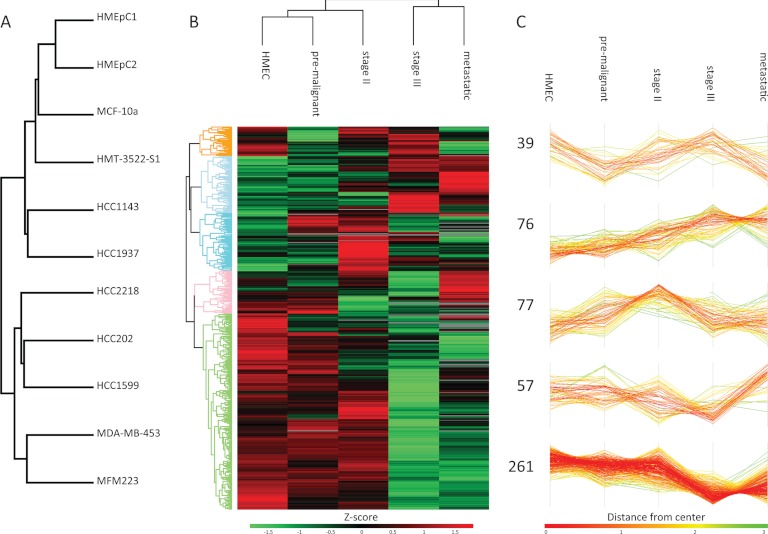
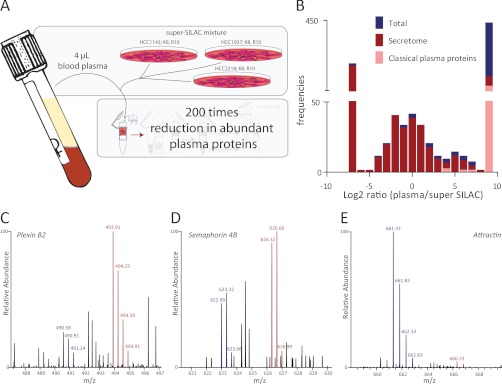
Cells secrete a large number of proteins to communicate with their surroundings. Furthermore, plasma membrane proteins and intracellular proteins can be released into the extracellular space by regulated or non-regulated processes. Here, we profiled the supernatant of 11 cell lines that are representative of different stages of breast cancer development by specifically capturing N-glycosylated peptides using the N-glyco FASP technology. For accurate quantification we developed a super-SILAC mix from several labeled breast cancer cell lines and used it as an internal standard for all samples. In total, 1398 unique N-glycosylation sites were identified and quantified. Enriching for N-glycosylated peptides focused the analysis on classically secreted and membrane proteins. N-glycosylated secretome profiles correctly clustered the different cell lines to their respective cancer stage, suggesting that biologically relevant differences were detected. Five different profiles of glycoprotein dynamics during cancer development were detected, and they contained several proteins with known roles in breast cancer. We then used the super-SILAC mix in plasma, which led to the quantification of a large number of the previously identified N-glycopeptides in this important body fluid. The combination of quantifying the secretome of cancer cell lines and of human plasma with a super-SILAC approach appears to be a promising new approach for finding markers of disease.


Figures

Fig. 1.
Fig. 1.
Overview of the experimental workflow. A, The secretome was collected as conditioned medium from cell lines in culture. HCC1143, HCC1937 and HCC2218 were also cultured under SILAC conditions to generate a super-SILAC mix as an internal standard. B, N-glycosylated peptides were enriched using N-glyco FASP. Proteins were first digested to peptides and N-glycosylated peptides were then captured using lectins. Finally, N-glycosylated peptides were released by deglycosylation using PNGase F and the deglycosylated peptides were analyzed by LC-MS.
Fig. 2.
Fig. 2.
Summary statistics of identified N-glycosylation sites. A, Number of unique N-glycosylation sites identified in each cell line. B, Overlap of N-glycosylation sites between different cell lines. C, Number of N-glycosylation sites identified per protein.
Fig. 3.
Fig. 3.
Effect of normalization using the super-SILAC internal standard. A, Correlation of intensities of light N-glycosylated peptides intensities between different replicates and cell lines (light channel of SILAC measurements only). Samples are ordered horizontally and vertically according to replicates and cell line (from HMEpC1 until MDA-MB-453). B, Correlation of intensities of heavy isotope labeled N-glycosylated peptides (super-SILAC internal standard) intensities between different replicates and cell lines. C, Correlation of N-glycosylated peptide ratios between different replicates and cell lines after normalization using the super-SILAC internal standard. Correlations between replicates (“green blocks” near the diagonal) and cell lines from the same cancer stages are increased, whereas differences with other cell lines are augmented. D, Correlation between replicates from each cell line at the N-glycosylated peptide level (from panel A and C) and protein level (based on nonglycosylated and glycosylated peptides) before and after normalization using the super-SILAC internal standard. Pearson's r was calculated between all replicates from each cell line. Two aberrant measurements (one from HMEpC2 and one from HCC1937) were omitted.
Fig. 4.
Fig. 4.
Hierarchical clustering of N-glycosylation abundance profiles. A, Hierarchical clustering based on Euclidean distance at the cell line level. B, Hierarchical clustering based on Euclidean distance at the cancer stage level of N-glycosylation sites that showed a significant difference between healthy mammary epithelial cells (HMEC) and at least one other cancer stage. C, Five main clusters extracted from B).
Fig. 5.
Fig. 5.
N-glyco FASP applied to blood plasma. A, Blood plasma was mixed with the breast cancer cell secretome super-SILAC mix. The enrichment of N-glycosylated peptides, and thereby removal of nonglycosylated peptides, reduced the intensity of abundant plasma proteins by about 200 times. B, Distribution of ratios of N-glycosylation sites between the super-SILAC internal standard and plasma. Sites without a signal in the light or heavy SILAC channel were assigned a Log2 ratio of –7 and 9, respectively. Overlapping sites with the secretome data set are labeled in red, whereas classical plasma proteins (as taken from Anderson et al. (6)) are labeled in pink. C, D, E, example MS spectra of N-glycosylated peptides with differing ratios. C, IHVTIYN(de)CSFGR (3+), plexin B2, average ratio −1.75; D, FEAEHISN(de)YTAIIISR (3+), semaphorin 4B, average ratio 0.0; E, IDSTGN(de)VTNEIR (2+), attractin, average ratio 4.3.

References

    1. Hanash S. M., Baik C. S., Kallioniemi O. (2011) Emerging molecular biomarkers[mdash]blood-based strategies to detect and monitor cancer. Nat. Rev. Clin. Oncol. 8, 142–150 - PubMed
    1. Nagaraj N., Wisniewski J. R., Geiger T., Cox J., Kircher M., Kelso J., Paabo S., Mann M. (2011) Deep proteome and transcriptome mapping of a human cancer cell line. Mol. Syst. Biol. 7 - PMC - PubMed
    1. Beck M., Schmidt A., Malmstroem J., Claassen M., Ori A., Szymborska A., Herzog F., Rinner O., Ellenberg J., Aebersold R. (2011) The quantitative proteome of a human cell line. Mol. Syst. Biol. 7 - PMC - PubMed
    1. Geiger T., Madden S. F., Gallagher W. M., Cox J., Mann M. (2012) Proteomic portrait of human breast cancer progression identifies novel prognostic markers. Cancer Res. 72, 2428–2439 - PubMed
    1. Clark H. F., Gurney A. L., Abaya E., Baker K., Baldwin D., Brush J., Chen J., Chow B., Chui C., Crowley C., Currell B., Deuel B., Dowd P., Eaton D., Foster J., Grimaldi C., Gu Q. M., Hass P. E., Heldens S., Huang A., Kim H. S., Klimowski L., Jin Y. S., Johnson S., Lee J., Lewis L., Liao D. Z., Mark M., Robbie E., Sanchez C., Schoenfeld J., Seshagiri S., Simmons L., Singh J., Smith V., Stinson J., Vagts A., Vandlen R., Watanabe C., Wieand D., Woods K., Xie M. H., Yansura D., Yi S., Yu G. Y., Yuan J., Zhang M., Zhang Z. M., Goddard A., Wood W. I., Godowski P. (2003) The Secreted Protein Discovery Initiative (SPDI), a large-scale effort to identify novel human secreted and transmembrane proteins: A bioinformatics assessment. Genome Res. 13, 2265–2270 - PMC - PubMed

Publication types