. 2012 Oct 29;199(3):453-66.
doi: 10.1083/jcb.201204138. Epub 2012 Oct 22.

Rbms3 functions in craniofacial development by posttranscriptionally modulating TGF-β signaling

Affiliations

Rbms3 functions in craniofacial development by posttranscriptionally modulating TGF-β signaling

Chathurani S Jayasena et al. J Cell Biol. .

Abstract

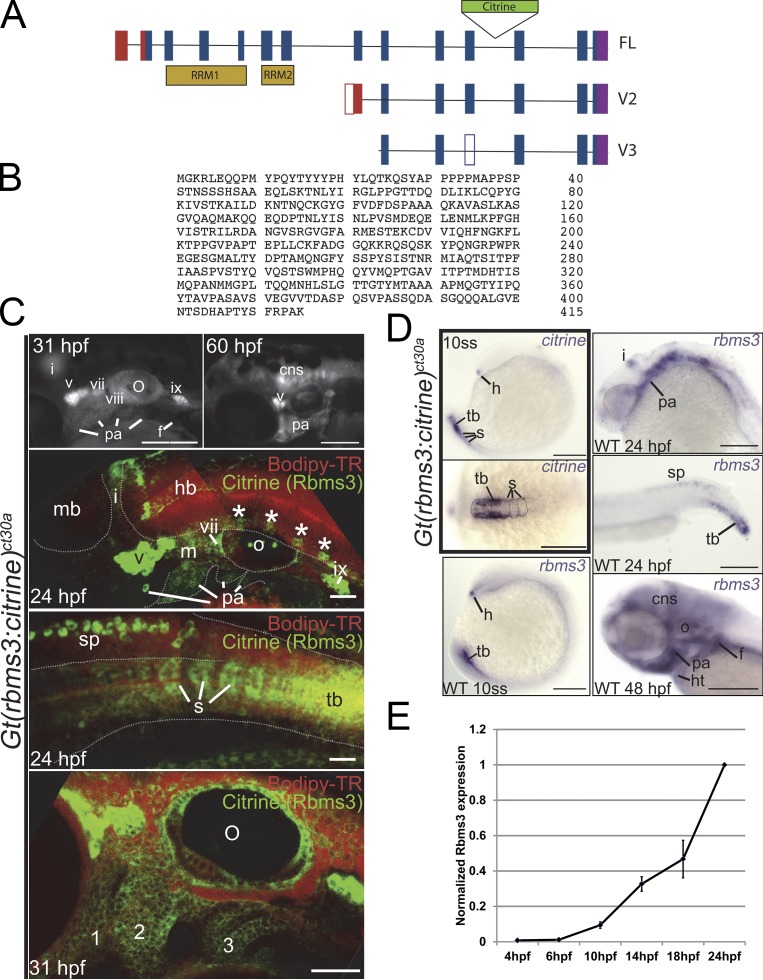
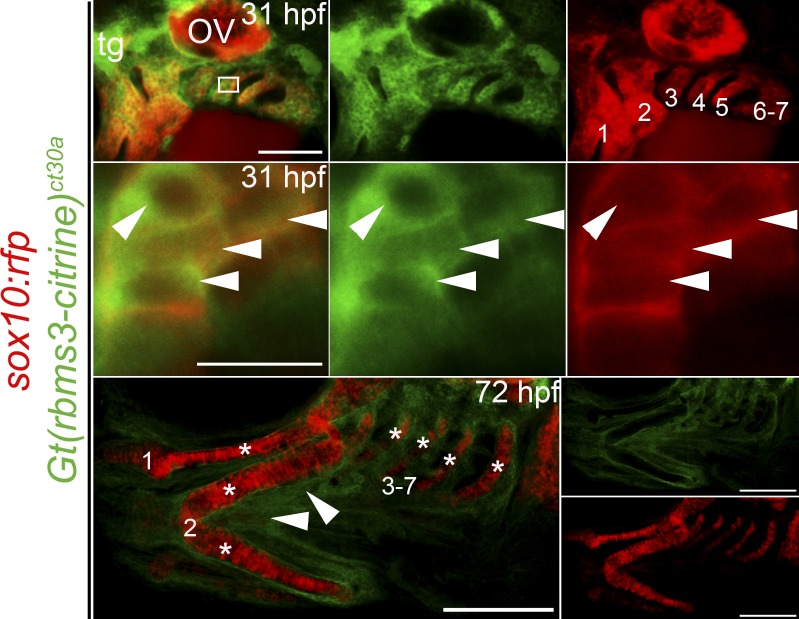
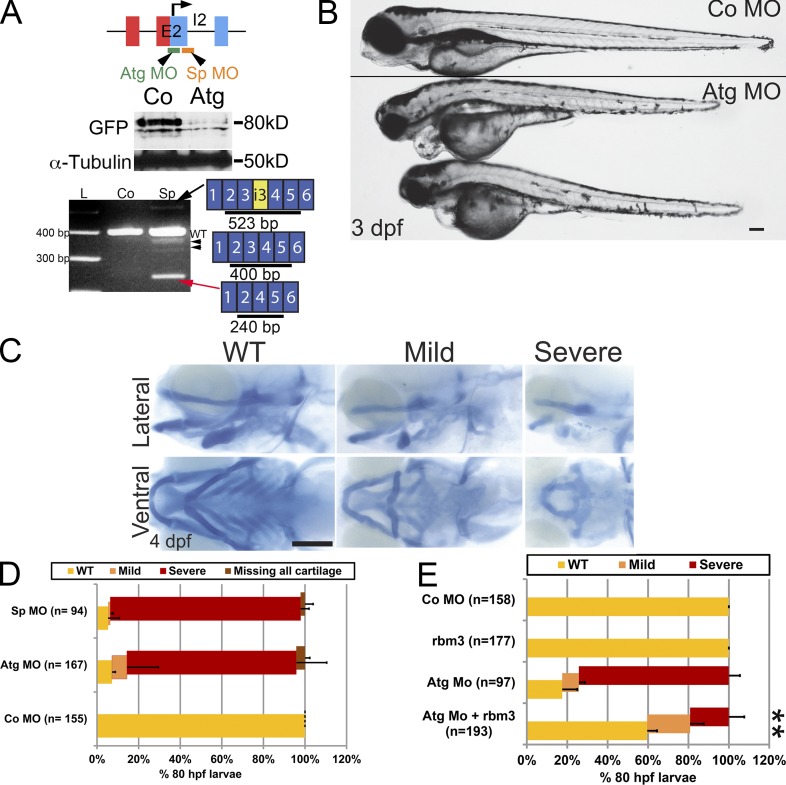
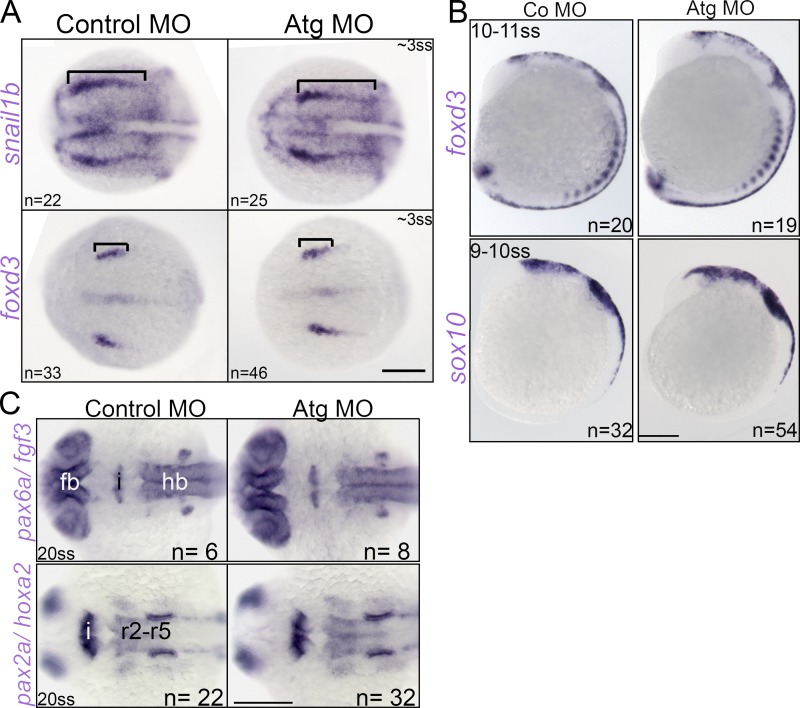
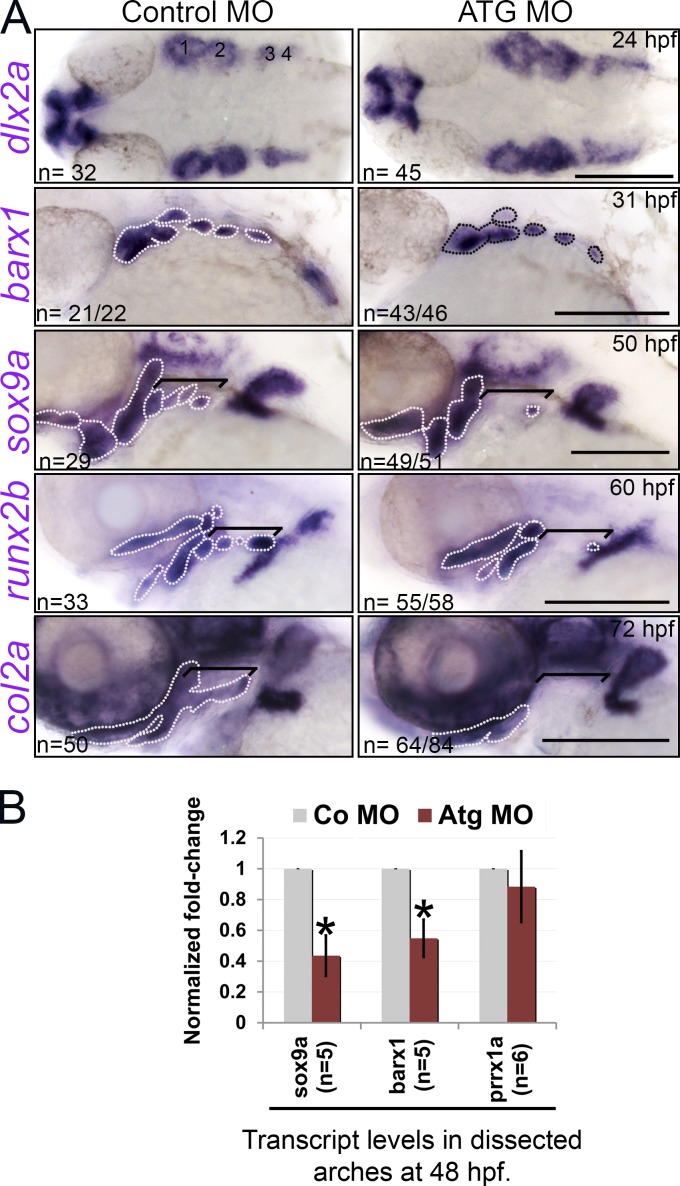
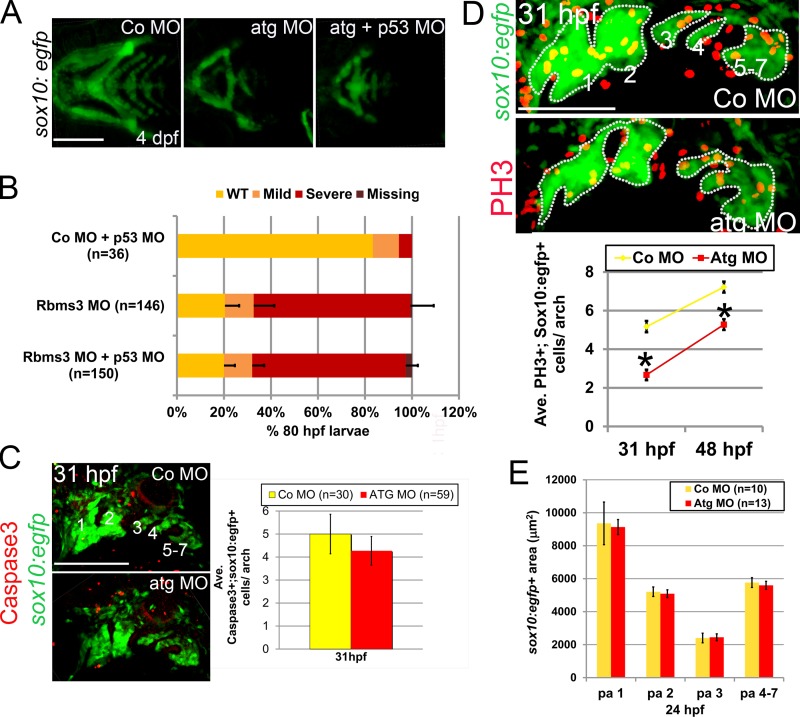
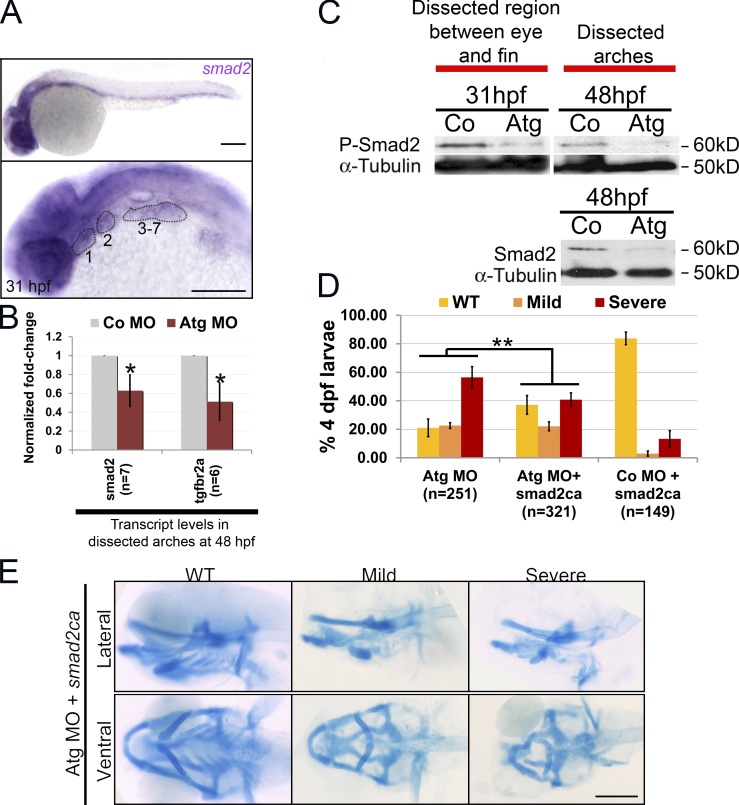
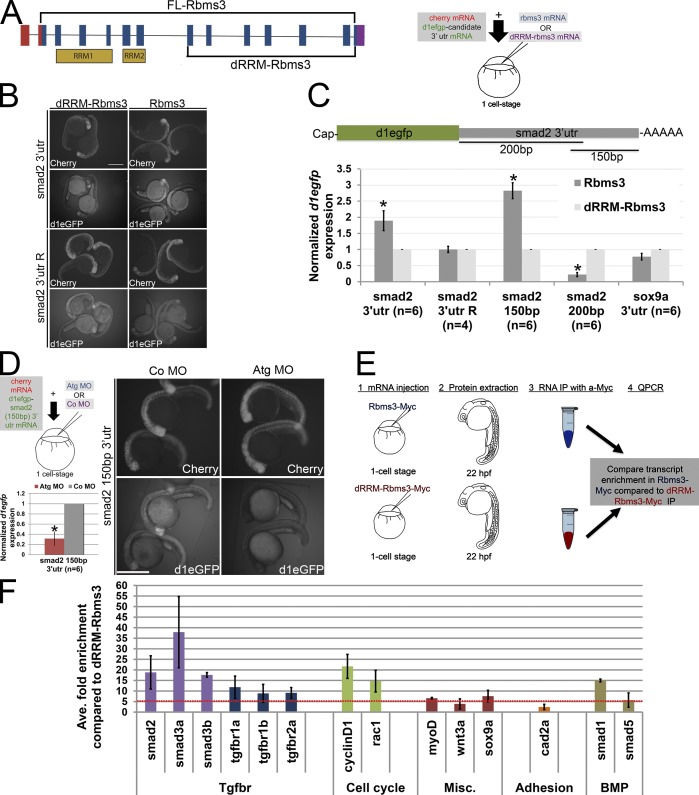
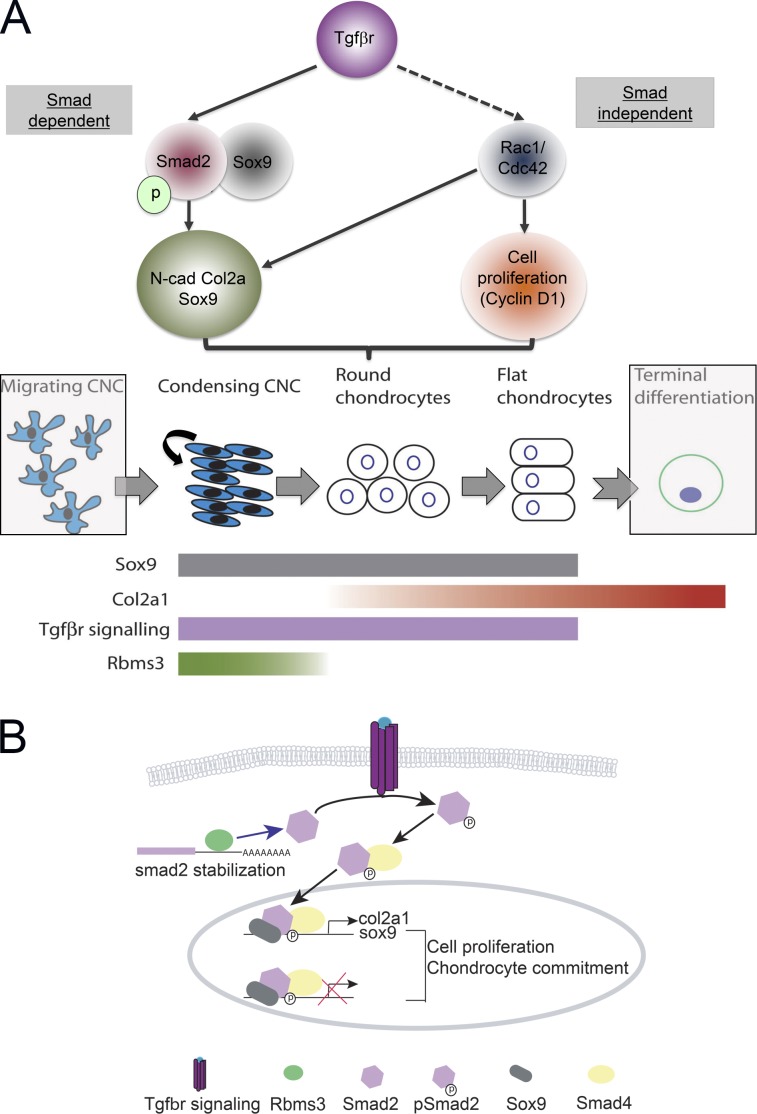
Cranial neural crest cells form much of the facial skeleton, and abnormalities in their development lead to severe birth defects. In a novel zebrafish protein trap screen, we identified an RNA-binding protein, Rbms3, that is transiently expressed in the cytoplasm of condensing neural crest cells within the pharyngeal arches. Morphants for rbms3 displayed reduced proliferation of prechondrogenic crest and significantly altered expression for chondrogenic/osteogenic lineage markers. This phenotype strongly resembles cartilage/crest defects observed in Tgf-βr2:Wnt1-Cre mutants, which suggests a possible link with TGF-β signaling. Consistent with this are the findings that: (a) Rbms3 stabilized a reporter transcript with smad2 3' untranslated region, (b) RNA immunoprecipitation with full-length Rbms3 showed enrichment for smad2/3, and (c) pSmad2 levels were reduced in rbms3 morphants. Overall, these results suggest that Rbms3 posttranscriptionally regulates one of the major pathways that promotes chondrogenesis, the transforming growth factor β receptor (TGF-βr) pathway.


Figures

Figure 1.
Figure 1.
Structure and expression of zebrafish rbms3. (A) Full-length and rbms3 variants v2 and v3 were identified using RACE. (B) Full-length zebrafish Rbms3 is 415 amino acids long. (C and D) Endogenous Rbms3 expression as denoted by Citrine expression in the Gt(rbms3-citrine)ct30a line (C); this closely resembles rbms3 transcript expression in wild-type (WT) zebrafish (D). (C) Citrine fluorescence is detected in craniofacial structures from 24 hpf to 60 hpf. 31 hpf and 60 hpf: live whole-mount images. 24 hpf: confocal z-stacks of the head region (top) and tail region (bottom) in live Gt(rbms3-citrine)ct30a homozygotes stained with the vital dye Bodipy-TR (red). Asterisks indicate Rbms3-expressing neurons. cns, central nervous system; cranial ganglia, v, vii, viii, ix, and x; f, fin bud; hb, hindbrain; i, isthmus; m, mesenchyme; mb, midbrain; o, otic vesicle; pa, pharyngeal arches; s, somites; sp, spinal chord; tb, tail bud mesoderm. 31 hpf: confocal section of head region showing expression in the pharyngeal arches (1–3). (D) Citrine transcript is detected at 10 ss (boxed region in the right panel) in the hatching gland (h), tail bud mesoderm (tb), and somites (s, outlined). Lateral (top) and dorsal (bottom) views shown. (E) QPCR analysis of Rbms3 expression during early embryonic development (n = 3). Error bars indicate SD. Bars: (C, top two fluorescent images; and D) 200 µM; (C, bottom three images) 50 µM.
Figure 2.
Figure 2.
Rbms3 is expressed by PCC. Citrine-tagged Rbms3 is transiently expressed by PCC (arrowheads, yellow/orange) in the pharyngeal arches (1–7) at 31 hpf (top two rows) and predominantly localized to the cytoplasm (middle row). The boxed region in the top left panel is magnified in the middle row. At 72 hpf, Rbms3 is excluded by cartilage (asterisks) but maintained by surrounding tissue (arrowheads) in the pharyngeal arches (1–7; bottom row). Sox10:rfp (red) marks PCC and cartilage. Bars: (top) 100 µM; (middle) 10 µM; (bottom) 200 µM.
Figure 3.
Figure 3.
Craniofacial defects in rbms3 morphants. (A) rbms3 MO design (E2, exon 2; I2, intron 2). Atg MO treatment results in knockdown of Citrine-Rbms3 (middle). Sp MO results in skipping of exon 3 (red arrow), and some transcripts maintain a portion of intron 3 (i3, yellow, black arrow), resulting in truncated Rbms3 products. The Sp MO also generates other minor splice variants (black arrowheads). (B) Atg morphants (boxed larvae) show craniofacial defects. (C) Alcian blue cartilage staining in Atg MO–treated fish. Top row, lateral view; bottom row, ventral view. (D) Quantification of cartilage phenotype for Sp and Atg MOs. (E) Full-length rbms3 partially/fully rescues Atg MO severe phenotype (**, P < 0.001, χ2 test). n = total number of treated fish from 3–4 experiments (D and E). Error bars indicate SD. Bars, 200 µM.
Figure 4.
Figure 4.
Early CNC and neural development in rbms3 morphants. (A) Dorsal view of neural plate border markers snail1b and foxd3. Bracket: anterior-posterior extent of domain is unchanged. (B) Pre-migratory foxd3 and sox10 CNC expression is unchanged. (C) Dorsal views of neural marker expression. Fb, forebrain (pax6a); hb, hindbrain (pax6a, hox2a); and i, isthmic regions (fgf3, pax2a). r2-r5, rhombomeres 2–5. Bars, 200 µM.
Figure 5.
Figure 5.
PCC differentiation is affected in rbms3 morphants. (A) dlx2a PCC condensations are normal (1–4) yet PCC/chondrogenic (barx1, sox9a, and col2a1a) and osteogenic (runx2b) markers are severely affected in morphants. Area highlighted by the broken lines and brackets: pharyngeal arch expression. Brackets: posterior arch expression. Bars, 200 µM. (B) QPCR shows reduction in sox9a and barx1 in rbms3 morphants. Error bars indicate SD. *, P < 0.005 (Student’s t test). n = independent pools of RNA.
Figure 6.
Figure 6.
Cell proliferation is defective in rbms3 morphants. (A and B) Co-injection of Atg MO with p53 MO does not rescue the cartilage phenotype. (A) Ventral views of MO-injected fish. (B) Quantitation of the cartilage phenotype: Atg MO coinjected with p53 MO. P > 0.05 (χ2 test). n = number of larvae pooled from three experiments. Error bars indicate SD. (C) There is no difference in activated Caspase-3 (red) expression in the pharyngeal arches (green; 1–7) in rbms3 morphants. Lateral view of MO-injected sox10:egfp fish at 31 hpf and quantitation of bifluorescent activated Caspase-3+;sox10:egfp+ cells. Error bars indicate SEM. P = 0.5 (Student’s t test). (D) Cell proliferation marker PH3 (red) is reduced in rbms3 morphant pharyngeal arches (green; 1–7). Lateral view of MO-injected sox10:egfp fish at 31 hpf and quantitation of bifluorescent PH3+ and sox10:egfp+ cells in the pharyngeal arches at 31 and 48 hpf. Error bars indicate SEM. *, P < 0.0001 (Student’s t test). (E) Domain of pharyngeal arch (pa) sox10:egfp expression is comparable between MO treatments at 24 hpf. Error bars indicate SD. n = number of fish (B–E). Bars: (A and C) 200 µM; (D) 100 µM.
Figure 7.
Figure 7.
Smad2 signaling is defective in rbms3 morphants. (A) At 31 hpf, smad2 is expressed in the pharyngeal arches (numbered and highlighted). (B) QPCR shows that smad2 and tgf-βr2a are reduced in rbms3 morphants at 48 hpf. Error bars indicate SD. *, P < 0.005 (two-tailed Student’s t test). n = independent pools of RNA. (C) pSmad2 (top) and total Smad2 (bottom) is reduced in rbms3 morphants. (D and E) Quantitation of phenotype (D) and cartilage staining (E) of fish coinjected with smad2ca and Atg MO. **, P < 0.001 (χ2 test). Bars, 200 µM.
Figure 8.
Figure 8.
Smad2 transcripts are a target of Rbms3. (A) dRRM-Rbms3 lacks the putative RNA-binding domains (RRM; lower bracket, left). A schematic showing an in vivo stability assay is shown on the right. (B and C) Fluorescent images (B) and QPCR (C; d1egfp normalized to cherry) showing that full-length Rbms3 treatment stabilizes d1egfp-smad2 3′ utr and d1egfp-smad2 (150bp) 3′ utr reporters. (D) Schematic shows the experiment (top left), QPCR (d1egfp normalized to cherry; bottom left), and fluorescent images (right) showing that Atg MO treatment destabilizes d1egfp-smad2 (150bp) 3′ utr. (B and D) Images were taken under same brightness/contrast conditions. (E) Schematic of RIP experiment. (F) QPCR showing transcripts enriched (more than fivefold, red dotted line) for full-length Rbms3 (n = 2–3 experiments). Error bars indicate SEM (C) and SD (D and F). n = RNA from individual embryos (C and D). *, P < 0.05 (Student’s t test). Bars, 500 µM.
Figure 9.
Figure 9.
Rbms3 function during cartilage formation. (A) Schematic showing how the TGF-βr signaling (Smad-dependent and -independent pathways) affects chondrocyte differentiation (top) and how chondrocytes differentiate from migrating CNC (bottom). Cells not responding to TGF-βr signaling are in shaded gray boxes. Migrating CNC form PCC condensations in the pharyngeal arches. Here, Sox9+ (gray) CNC proliferate (black arrow) and receive TGF-β signals (purple), which drives them down the chondrogenic lineage. During development, these cells gradually increase production of Col2a1 (graded red) and reach terminal differentiation. Rbms3 (graded green) is transiently expressed as CNC condense and is gradually excluded from committed chondrocytes. (B) Rbms3 functions to stabilize smad2 transcripts by binding to smad2 3′ utr. This increases/maintains the pool of Smad2 available to receive TGF-βr signaling. Upon Tgf-βr signaling, pSmad2–Smad4 complexes enter the nucleus (Liu, 2003) and bind to Sox9 to: (a) activate transcription of cartilage gene col2a1 (Furumatsu et al., 2005), (b) maintain levels of sox9 (Ito et al., 2003; Wurdak et al., 2005), and (c) repress a battery of other transcription factors (Ito et al., 2003). This drives the PCC to proliferate and commit toward the chondrogenic lineage (Ito et al., 2003; Wurdak et al., 2005).

References

    1. Akiyama H., Chaboissier M.-C., Martin J.F., Schedl A., de Crombrugghe B. 2002. The transcription factor Sox9 has essential roles in successive steps of the chondrocyte differentiation pathway and is required for expression of Sox5 and Sox6. Genes Dev. 16:2813–2828 10.1101/gad.1017802 - DOI - PMC - PubMed
    1. Alexander C., Zuniga E., Blitz I.L., Wada N., Le Pabic P., Javidan Y., Zhang T., Cho K.W., Crump J.G., Schilling T.F. 2011. Combinatorial roles for BMPs and Endothelin 1 in patterning the dorsal-ventral axis of the craniofacial skeleton. Development. 138:5135–5146 10.1242/dev.067801 - DOI - PMC - PubMed
    1. Bi W., Deng J.M., Zhang Z., Behringer R.R., de Crombrugghe B. 1999. Sox9 is required for cartilage formation. Nat. Genet. 22:85–89 10.1038/8792 - DOI - PubMed
    1. Cheah F.S.H., Winkler C., Jabs E.W., Chong S.S. 2010. Tgfbeta3 regulation of chondrogenesis and osteogenesis in zebrafish is mediated through formation and survival of a subpopulation of the cranial neural crest. Mech. Dev. 127:329–344 10.1016/j.mod.2010.04.003 - DOI - PubMed
    1. Clements W.K., Ong K.G., Traver D. 2009. Zebrafish wnt3 is expressed in developing neural tissue. Dev. Dyn. 238:1788–1795 10.1002/dvdy.21977 - DOI - PMC - PubMed

Publication types

MeSH terms

Substances