Comparative Study
. 2012 Nov 19;209(12):2183-98.
doi: 10.1084/jem.20120833. Epub 2012 Oct 22.

Cellular origin and pathophysiology of chronic lymphocytic leukemia

Affiliations
Comparative Study

Cellular origin and pathophysiology of chronic lymphocytic leukemia

Marc Seifert et al. J Exp Med. .

Abstract

The cellular origin of chronic lymphocytic leukemia (CLL) is still debated, although this information is critical to understanding its pathogenesis. Transcriptome analyses of CLL and the main normal B cell subsets from human blood and spleen revealed that immunoglobulin variable region (IgV) gene unmutated CLL derives from unmutated mature CD5(+) B cells and mutated CLL derives from a distinct, previously unrecognized CD5(+)CD27(+) post-germinal center B cell subset. Stereotyped V gene rearrangements are enriched among CD5(+) B cells, providing independent evidence for a CD5(+) B cell derivation of CLL. Notably, these CD5(+) B cell populations include oligoclonal expansions already found in young healthy adults, putatively representing an early phase in CLL development before the CLL precursor lesion monoclonal B cell lymphocytosis. Finally, we identified deregulated proteins, including EBF1 and KLF transcription factors, that were not detected in previous comparisons of CLL and conventional B cells.


Figures

Figure 1.
Figure 1.
Hierarchical clustering of normal human B cell subsets and CLL. The dendrogram is based on a Spearman ranking of 2000 transcripts with highest SD (Table S1). Subcluster stability was confirmed by bootstrapping procedure (>70%). The color bar depicts normalized intensity values. CD5+, CD5+CD27CD38low B cells; naive, conventional naive B cells; mCLL, IgV mutated CLL; uCLL, IgV unmutated CLL; class-switched, IgG+CD27+ and IgA+CD27+ B cells; IgM+IgD+ memory, IgM+IgD+CD27+ and IgM-only B cells; sMGZ, splenic marginal zone B cells.
Figure 2.
Figure 2.
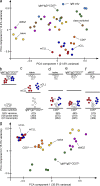
PCA of CD5+ and CD5 conventional B cell subsets and CLL. (a) Unsupervised PCA shows a high similarity of CLL to CD5+ B cells, but not conventional B cells. The PCA is based on 10,395 annotated transcripts, explaining >35% of total variance. Axis scaling according to mean centering and scaling. Samples belonging to distinct subsets are depicted in the same color. (b–f) Supervised PCA showing mathematical distances of mCLL (red) and uCLL (blue) according to the first principal component of pairwise compared normal B cell subsets (annotated transcripts, >twofold change; P < 0.05; FDR < 0.05). Subset samples are depicted on top or bottom. Black bars represent maximum distances and baseline according to mean centering and scaling. (g) Supervised PCA of CLL and selected normal B cell samples. Shown are mathematical distances of CLL cases and CD5+ and conventional B cell subsets according to 27 annotated transcripts differentially expressed between CLL and follicular lymphoma or diffuse large B cell lymphoma. Axis scaling according to mean centering and scaling.
Figure 3.
Figure 3.
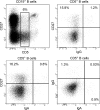
Flow cytometric analysis of CD5+ human PB B cells of a healthy donor. Depicted are FACS plots of CD19-enriched human lymphocytes stained for CD5, CD27, IgG, and IgA expression. (top left) CD19+ B cells contain a small fraction of CD5+CD27+ B cells. CD5highCD27high events represent residual T cells, as verified by CD3 staining (not depicted), and therefore were excluded by gating procedure. (top right and bottom left) CD5+CD27+ B cells contain minor populations of class-switched IgG+ or IgA+ B cells. These stainings are specific, as there are no IgA+IgG+ double-positive B cells detectable (bottom right). Data are representative of 10 healthy donors.
Figure 4.
Figure 4.
Unsupervised hierarchical clustering and supervised PCA of normal mature PB CD5+ B cell subsets and CLL samples. (a) Highly purified CD5+CD27CD38low naive B cells (yellow), CD5+CD27+CD38CD43 memory B cells (green), and mCLL (red) and uCLL (blue) were included in a HuGene-1_0-st-v1 GEP study. Hierarchical clustering is based on 500 transcripts with the highest SD, according to Manhattan clustering and average linkage method. This clustering is representative for dendrograms based on 250–3,500 transcripts. (b) The PCA is based on 104 genes (twofold change; P < 0.05; FDR< 0.05) differentially expressed between CD5+CD27 and CD5+CD27+ B lymphocytes. mCLL (red) and uCLL (blue) are displayed along the first principal component, covering >59% of total variance. (c) PCA with 107 CLL cases from an independent exon expression study (Table S6). Only probe sets scored with “best match” in a HuGene-HuExon array comparison (Affymetrix) were considered, resulting in 79 genes present on both platforms. The abscissa depicts the Eigenvector values of the similarity matrix associated with the dataset according to mean centering (mean zero) and scaling (to unit SD). The distribution of the data points along the ordinate was chosen arbitrarily to display all data points separately.
Figure 5.
Figure 5.
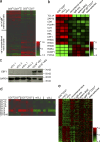
Evaluation of CD5+ B cell and CLL gene expression profiles. (a) Heatmap of CD5+ B cell subset transcription patterns of genes with differential expression between conventional naive and IgM+ memory B cells (Table S9). The color bar depicts normalized intensity values. (b) Heatmap of selected genes with similar transcription in CD5+ B cells and CLL (Table S11). (c) Immunoblotting of EBF1. Protein lysates of CLL and CD19+ B cells from healthy donors were analyzed for EBF1 and GAPDH content. Data are representative of 10 CLL analyzed. (d) Expression heatmap of selected KLF family members in CLL and CD5+ B cells. GEP of normal CD5+ B cell subsets and CLL were filtered for KLF family members with differential expression within the four cell types (Table S12). Depicted are normalized signal intensities. (e) Differentially expressed transcripts (>twofold-change; P < 0.05; FDR < 0.05) between uCLL and CD5+CD27 B cells (HG U133 array), but not (<twofold change; P < 0.05; FDR < 0.05) between uCLL and bulk conventional B cells (naive and memory B cells combined). All transcripts in this list (Table S14) are considered as deregulated genes in CLL that were not detectable (or underestimated) in analyses including conventional CD19+ B cells. Normalized signal intensities are shown.
Figure 6.
Figure 6.
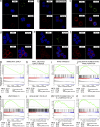
Fluorescence microscopic analysis and GSEA of CD5+ B cells and CLL. CD5+ B cells and CLL cells were stained for intracellular MYC, KLF2, or KLF3 expression (green). DNA and actin were stained with Hoechst 33258 (blue) and Phalloidin-TRITC (red), respectively. MYC was expressed in <1% of CD5+ B cells (a), as compared with isotype negative control stainings (b). Sporadic KLF2 expression was detectable in CD5+ B cells (c) but never in CLL (d). KLF3 was expressed in 28–40% of CD5+ B cells (e) and in 1–5% of CLL cells (f) as determined by two independent blind studies of two normal CD5+ B cell samples and two CLL each (Table S13). Pictures are representative of four healthy donors and five CLL analyzed. (g–n) shows selected plots from a GSEA based on 24,000 probe sets of 5 CD5+CD27 and 5 CD5+CD527+ B cell GEP combined with 7 conventional naive B cell GEP or 9 CLL GEP, irrespective of the mutation status. Normalized enrichment score (NES), nominal p-value (p), and FDR (q) are given for each plot. (g–k) CD5+CD27 B cells are shown on the left side (red) of the plots, conventional naive B cells on the right side (blue). (g) Immediate early genes, (h) delayed early genes, (i) NF-κB target genes, (j) homeostatic proliferation genes, (k) MYC/MAX target genes. (l–n) pools of CD5+ B cell subsets are shown on the left side (red), CLL on the right side (blue). (l) EBF1 target genes, (m) genes up-regulated in plasma cells versus B cells, (n) KLF2-induced genes.

References

    1. Allman D., Jain A., Dent A., Maile R.R., Selvaggi T., Kehry M.R., Staudt L.M. 1996. BCL-6 expression during B-cell activation. Blood. 87:5257–5268 - PubMed
    1. Andréasson U., Edén P., Peterson C., Högerkorp C.M., Jerkeman M., Andersen N., Berglund M., Sundström C., Rosenquist R., Borrebaeck C.A., Ek S. 2010. Identification of uniquely expressed transcription factors in highly purified B-cell lymphoma samples. Am. J. Hematol. 85:418–425 - PubMed
    1. Bachl J., Carlson C., Gray-Schopfer V., Dessing M., Olsson C. 2001. Increased transcription levels induce higher mutation rates in a hypermutating cell line. J. Immunol. 166:5051–5057 - PubMed
    1. Barrena S., Almeida J., Yunta M., López A., Fernández-Mosteirín N., Giralt M., Romero M., Perdiguer L., Delgado M., Orfao A., Lazo P.A. 2005. Aberrant expression of tetraspanin molecules in B-cell chronic lymphoproliferative disorders and its correlation with normal B-cell maturation. Leukemia. 19:1376–1383 10.1038/sj.leu.2403822 - DOI - PubMed
    1. Berland R., Wortis H.H. 2002. Origins and functions of B-1 cells with notes on the role of CD5. Annu. Rev. Immunol. 20:253–300 10.1146/annurev.immunol.20.100301.064833 - DOI - PubMed

Publication types

MeSH terms

Substances