. 2012 Nov 19;209(12):2291-305.
doi: 10.1084/jem.20111749. Epub 2012 Oct 22.

ProNGF, a cytokine induced after myocardial infarction in humans, targets pericytes to promote microvascular damage and activation

Affiliations

ProNGF, a cytokine induced after myocardial infarction in humans, targets pericytes to promote microvascular damage and activation

Chia-Jen Siao et al. J Exp Med. .

Abstract

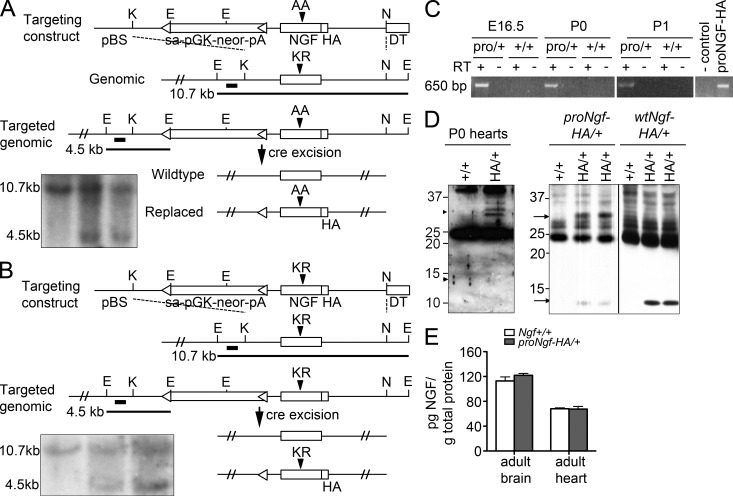
Treatment of acute cardiac ischemia focuses on reestablishment of blood flow in coronary arteries. However, impaired microvascular perfusion damages peri-infarct tissue, despite arterial patency. Identification of cytokines that induce microvascular dysfunction would provide new targets to limit microvascular damage. Pro-nerve growth factor (NGF), the precursor of NGF, is a well characterized cytokine in the brain induced by injury. ProNGF activates p75 neurotrophin receptor (p75(NTR)) and sortilin receptors to mediate proapoptotic responses. We describe induction of proNGF by cardiomyocytes, and p75(NTR) in human arterioles after fatal myocardial infarction, but not with unrelated pathologies. After mouse cardiac ischemia-reperfusion (I-R) injury, rapid up-regulation of proNGF by cardiomyocytes and p75(NTR) by microvascular pericytes is observed. To identify proNGF actions, we generated a mouse expressing a mutant Ngf allele with impaired processing of proNGF to mature NGF. The proNGF-expressing mouse exhibits cardiac microvascular endothelial activation, a decrease in pericyte process length, and increased vascular permeability, leading to lethal cardiomyopathy in adulthood. Deletion of p75(NTR) in proNGF-expressing mice rescues the phenotype, confirming the importance of p75(NTR)-expressing pericytes in the development of microvascular injury. Furthermore, deficiency in p75(NTR) limits infarct size after I-R. These studies identify novel, nonneuronal actions for proNGF and suggest that proNGF represents a new target to limit microvascular dysfunction.


Figures

Figure 1.
Figure 1.
Expression of proNGF and its receptors p75NTR and SorCS2 are coordinately up-regulated after myocardial ischemia in humans and mice. (A) Immunohistochemical detection of the prodomain of proNGF demonstrates increased proNGF reactivity in both cardiomyocytes and in vascular smooth muscle cells (arrow) in the peri-infarct region of the hearts of patients that died from recent MI (post-MI, right) compared with patients that died of noncardiac related causes (control, right). (B) Immunohistochemical detection of p75NTR demonstrates induction of p75NTR in mural cells of arterioles in post-MI patients (right, arrow) compared with noncardiac patients (control, left). Arrowhead indicates p75NTR positive nerve fiber. (C) Quantification of proNGF immunoreactivity in cardiac myocytes of noncardiac patients and from the peri-infarct region of post-MI patients. ProNGF immunoreactivity in cardiomyocytes was quantified using a semiquantitative method in which 10 fields of view were scored by a blinded individual. Each field of view was given a score of 0–4: 0 for absence of immunoreactivity, 1 for weak immunoreactivity, 2 for modest immunoreactivity, 3 for moderate immunoreactivity, and 4 for strong immunoreactivity. The scores from the fields of view were averaged. (D and E) Quantification of proNGF and p75NTR immunoreactivity in the cardiac arteries (D) and veins (E) of the peri-infarct region of post-MI patients and noncardiac patients. The number of proNGF or p75NTR positive vessels is presented as a percentage of total vessels counted. The scores were averaged and the error bars represent the SEM. *, P < 0.05; ***, P < 0.001. (F) Immunohistochemical detection of SorCS2 demonstrates induction of SorCS2 in the cardiac vasculature (arrow) of post-MI patients compared with noncardiac patients. (G) Immunohistochemical detection of the prodomain of proNGF demonstrates increased proNGF reactivity in the infarct and peri-infarct regions of the mouse heart after I-R surgery (24 h I-R, right, arrow indicates proNGF-positive vascular smooth muscle cells) compared with sham-operated animals (24 h sham, left). (H) Immunohistochemical detection of p75NTR in the mouse heart after I-R reveals induction of cell-associated p75NTR (right, arrows) compared with hearts from sham-operated mice in which p75NTR is primarily detected in cardiac nerve fibers (left). (A–F) n = 6 patients that died after myocardial ischemia, and five patients that died of noncardiac causes (G and H) n = 3–4 mice/group. Bars, 50 µm.
Figure 2.
Figure 2.
p75NTR and SorCS2, to which proNGF also binds, are up-regulated in PDGFR-β+ pericytes after I-R in mice. (A) Immunoprecipitation–Western blot analysis from 293T cells transfected with the indicated plasmids. The experiment was performed three independent times. (B) p75NTR (red) expression on PDGFR-β+ (green) pericytes in the peri-infarct regions of injured hearts compared with pericytes of uninjured myocardium. (C) SorCS2 (red) expression in a population of pericytes coexpressing PDGFR-β (green) in the injured myocardium after I-R. (B and C) Bar, 25 µm. n = 3 mice/group.
Figure 3.
Figure 3.
Generation and characterization of the proNgf-HA/+ and wtNgf-HA/+ knock-in mice. (A) Schematic of ngf gene targeting with the prongf-HA allele. The dark bars indicate Southern blot probe sequence and expected product sizes. Inset, Southern blot analysis of genomic DNA. (B) Schematic of wild-type ngf-HA gene targeting. Inset, Southern blot analysis of genomic DNA. (C) RT-PCR analysis to detect proNGF-HA mRNA from embryonic day 16.5, postnatal day 0, and postnatal day 1 mouse hearts. Control, pcDNA vector. proNGF-HA, pcDNA-proNGF-HA plasmid positive control. The experiments were repeated two independent times. (D) Immunoprecipitation–Western blot analysis of proNGF or NGF expression. Left, representative lysates of P0 Ngf+/+ and proNgf-HA/+ hearts (three hearts pooled for each lane) analyzed for proNGF-HA (∼32 kD) and mature NGF-HA (∼13 kD) in proNgf-HA/+ and Ngf+/+ hearts, experiment performed two independent times. Right, similar analysis performed in adult brain lysates. Experiment was performed four independent times. The black line indicates that intervening lanes were spliced out. (E) ELISA for total levels of NGF protein isoforms in the brain and in the heart of Ngf+/+ versus proNgf-HA/+ mice (n = 3 mice/group, mean ± SD).
Figure 4.
Figure 4.
Adult proNgf-HA/+ mice exhibit dilated cardiomyopathy, fibrosis, and contractile dysfunction. (A–C) H&E-stained sections of hearts from 8-mo-old Ngf+/+, proNgf-HA/+, and p75−/−;proNgf-HA/+ mice. (D–F) Higher magnification images. (G–I) Masson’s trichrome analysis of hearts from 8-mo-old Ngf+/+, proNgf-HA/+, and p75−/−;proNgf-HA/+ mice. Red, myocardium. Black, nuclei. Blue, collagen matrix. (J) Quantification of cardiac fibrosis in 6–8-mo-old proNgf-HA/+ mice and Ngf+/+ littermate mice. Three to four fields of view from the subendocardium were analyzed for each animal and was averaged. Mean ± SEM, n = 4/genotype. (K) Fractional shortening in proNgf-HA/+ mice (solid red squares) compared with Ngf+/+ (blue diamonds), p75−/−:proNgf-HA/+ (open red squares), and sort−/−:proNgf-HA/+ mice (filled green triangles). ***, P < 0.005 proNgf-HA/+ compared with Ngf+/+; #, P < 0.05 sort−/−:proNgf-HA/+ compared with Ngf+/+, Student’s t test. Solid blue and red, and dashed red and green lines, linear regression curve for each genotype. (L) Kaplan-Meier graph of survival of Ngf+/+ (solid blue line), proNgf-HA/+ (solid red line), p75−/−;proNgf-HA/+ (red dotted line), and sort−/−;proNgf-HA/+ (green dotted line) mice. Bars: (A–C) 2 mm; (D–I) 100 µm. (A–I, K, and L) Ngf+/+, n = 18; proNgf-HA/+, n = 31; p75−/−;proNgf-HA/+, n = 14; sort−/−;proNgf-HA/+, n = 15.
Figure 5.
Figure 5.
Hearts from adult proNgf-HA/+ mice exhibit microvascular damage and hearts from juvenile proNgf-HA/+ mice show early signs of endothelial cell activation and microvascular damage. (A–C) Transmission electron microscopic images of hearts from 4-mo-old Ngf+/+, Ngf+/−, and proNgf-HA/+ mice, respectively. Arrowhead, microvascular endothelial cell with fragmented plasma membrane. (D–F) Normal H and E histology of 1-mo-old Ngf+/+, Ngf+/−, and proNgf-HA/+ hearts. (G–I) Representative transmission electron microscope images of hearts from 1-mo-old Ngf+/+, Ngf+/−, and proNgf-HA/+ mice. Microvascular endothelial cells from proNgf-HA/+ mice exhibit filamentous membrane projections into the vessel lumen (I, arrow). In the proNgf-HA/+ myocardium, ∼50% of microvascular endothelial cells examined showed signs of activation as well as perivascular edema (I, asterisk). Additionally, a loss of apposition in the processes of pericyte with endothelial cells is observed (arrowhead). Bars: (A–C and G–I) 2 µm; (D–F) 100 µm. n = 2/genotype.
Figure 6.
Figure 6.
Abnormalities in the microvasculature of hearts from proNgf-HA/+ mice. (A–C) Hearts from proNgf-HA/+ mice at postnatal day 9 analyzed for platelet deposition (as assessed by CD41 immunofluorescence, red) compared with Ngf+/+ and with p75−/−; proNgf-HA/+ myocardium. (D–F) ICAM-1 expression (red) in the proNgf-HA/+ myocardium compared with the Ngf+/+ and p75−/−;proNgf-HA/+ myocardium, at postnatal day 9. (G–I) FITC-dextran (green) accumulation and extravasation was examined in the myocardium from 3-mo-old proNgf-HA/+, Ngf+/+ and p75−/−;proNgf-HA/+ mice. (J and K) Quantification of CD41 and ICAM-1 immunofluorescence (n = 3–6 mice/condition, eight fields of view per mouse). *, P < 0.05; **, P < 0.01, mean ± SEM. Bar, 100 µm.
Figure 7.
Figure 7.
Expression of proNGF receptors during cardiac vessel development. E18.5 (A, B, and E) or E20.5 (C and D) C57BL6/J embryos were analyzed for p75NTR and SorCS2 immunoreactivity (hearts from Ngf+/+ and proNgf-HA/+ embryos yielded similar results). (A and B) p75NTR (green) does not colocalize with IB4 (red) on endothelial cells (A) but does colocalize with PDGFR-β (red), which labels pericytes (B). (C and D) SorCS2 immunoreactivity (green) is detected on a subset of PDGFR-β–immunopositive pericytes (red) at E20.5 but not on IB4+ endothelial cells (red). (E) p75NTR and SorCS2 are colocalized on some pericytes at E18.5. Single channel and overlays are shown. Bar, 25 µm. n = 3 mice per age.
Figure 8.
Figure 8.
Decreased pericyte process length in the hearts of 1-mo-old proNgf-HA/+ mice. (A) Mean pericyte process length in the hearts of 1-mo-old NG2dsRedBAC; proNgf-HA/+ mice compared with NG2dsRedBAC; Ngf+/+ littermates (**, P < 0.01, mean ± SD). (B) Pericyte process length from each individual animal analyzed. 20 pericytes per animal were measured. Pericytes from Ngf+/+ mice are shown in blue and proNgf-HA/+ are shown in red (mean ± SD). (C and D) Representative tracings of pericytes from NG2dsRedBAC; Ngf+/+ mice (C) and NG2dsRED; proNgf-HA/+ mice (D). Bars, 5 µm. Ngf+/+, n = 5; proNgf-HA/+, n = 3.
Figure 9.
Figure 9.
Infarct size is reduced in p75NTR deficient mice 10 d after I-R surgery. (A) Representative picture of a 1-mm heart section showing the area at risk determined by re-ligation of the left anterior coronary artery 10 d after surgery and perfusion with Evans blue dye. The area at risk is devoid of blue dye. (B) Representative picture of a Masson’s trichrome stain to identify the infarcted region of the heart (0.5 mm) 10 d after surgery. (C) The area at risk (percentage of total ventricular volume), determined by perfusion with Evans blue dye in p75−/− mice compared with wild-type mice. (D) Infarct size normalized to the area at risk in p75−/− mice compared with wild-type 10 d after I-R surgery. **, P < 0.01, mean ± SEM, n = 5–6 mice/genotype. Bars: (A) 1 mm; (B) 0.5 mm.

References

    1. Allt G., Lawrenson J.G. 2001. Pericytes: cell biology and pathology. Cells Tissues Organs (Print) 169:1–11 10.1159/000047855 - DOI - PubMed
    1. Armulik A., Abramsson A., Betsholtz C. 2005. Endothelial/pericyte interactions. Circ. Res. 97:512–523 10.1161/01.RES.0000182903.16652.d7 - DOI - PubMed
    1. Bekkers S.C., Yazdani S.K., Virmani R., Waltenberger J. 2010. Microvascular obstruction: underlying pathophysiology and clinical diagnosis. J. Am. Coll. Cardiol. 55:1649–1660 10.1016/j.jacc.2009.12.037 - DOI - PubMed
    1. Bjarnegård M., Enge M., Norlin J., Gustafsdottir S., Fredriksson S., Abramsson A., Takemoto M., Gustafsson E., Fässler R., Betsholtz C. 2004. Endothelium-specific ablation of PDGFB leads to pericyte loss and glomerular, cardiac and placental abnormalities. Development. 131:1847–1857 10.1242/dev.01080 - DOI - PubMed
    1. Camilleri J.P., Nlom M.O., Joseph D., Michel J.B., Barres D., Mignot J. 1983. Capillary perfusion patterns in reperfused ischemic subendocardial myocardium: experimental study using fluorescent dextran. Exp. Mol. Pathol. 39:89–99 10.1016/0014-4800(83)90043-6 - DOI - PubMed

Publication types

MeSH terms