. 2012;7(10):e47108.
doi: 10.1371/journal.pone.0047108. Epub 2012 Oct 16.

Accurate simulation and detection of coevolution signals in multiple sequence alignments

Affiliations

Accurate simulation and detection of coevolution signals in multiple sequence alignments

Sharon H Ackerman et al. PLoS One. 2012.

Abstract

Background: While the conserved positions of a multiple sequence alignment (MSA) are clearly of interest, non-conserved positions can also be important because, for example, destabilizing effects at one position can be compensated by stabilizing effects at another position. Different methods have been developed to recognize the evolutionary relationship between amino acid sites, and to disentangle functional/structural dependencies from historical/phylogenetic ones.

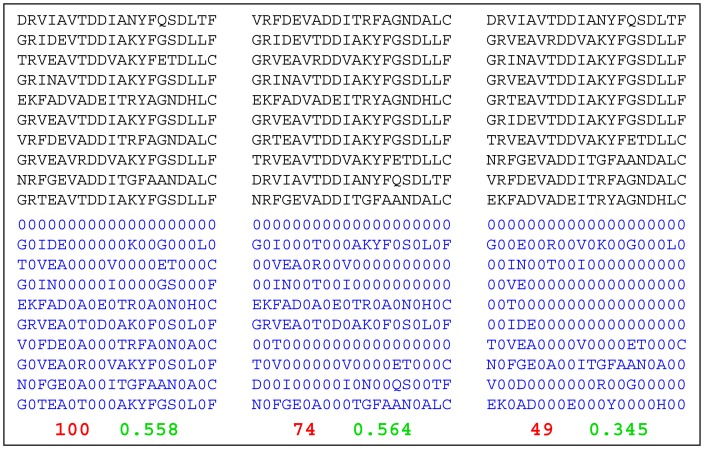
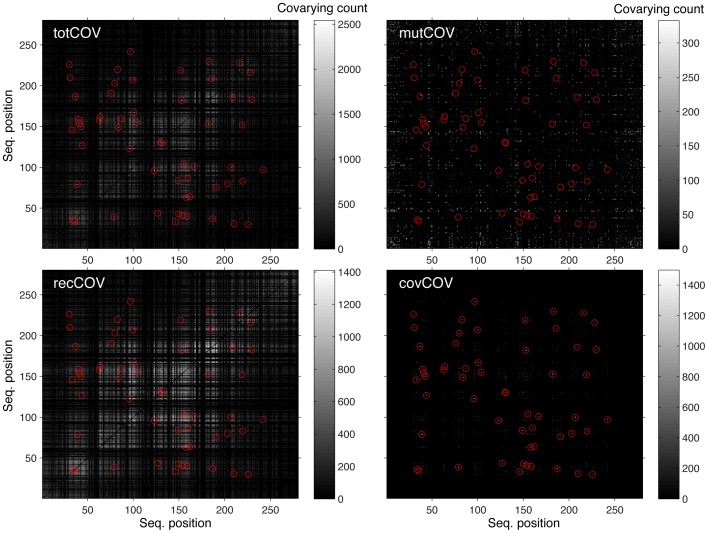
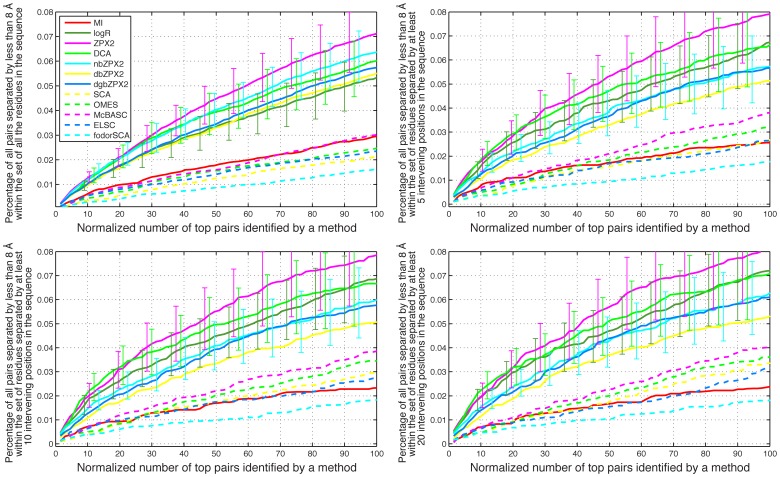
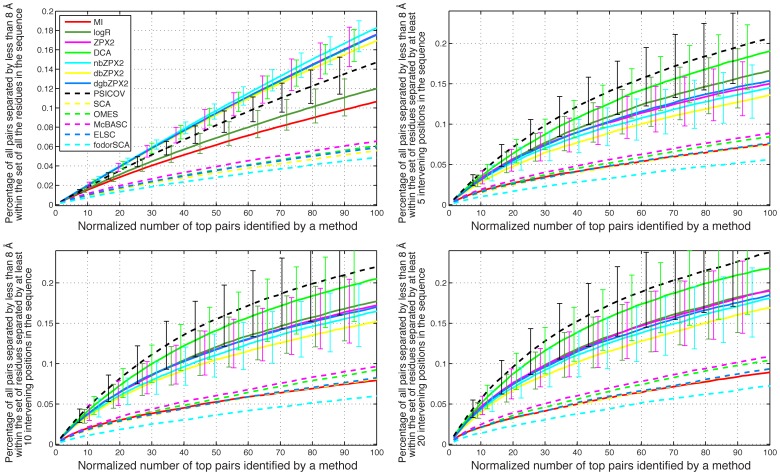
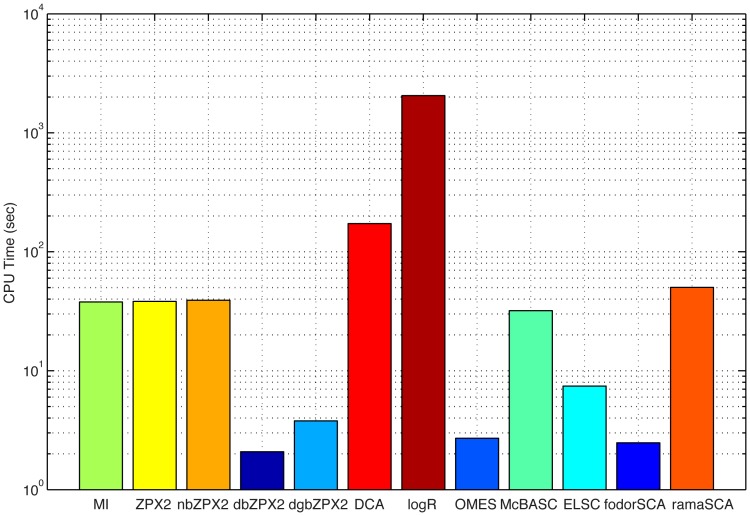
Methodology/principal findings: We have used two complementary approaches to test the efficacy of these methods. In the first approach, we have used a new program, MSAvolve, for the in silico evolution of MSAs, which records a detailed history of all covarying positions, and builds a global coevolution matrix as the accumulated sum of individual matrices for the positions forced to co-vary, the recombinant coevolution, and the stochastic coevolution. We have simulated over 1600 MSAs for 8 protein families, which reflect sequences of different sizes and proteins with widely different functions. The calculated coevolution matrices were compared with the coevolution matrices obtained for the same evolved MSAs with different coevolution detection methods. In a second approach we have evaluated the capacity of the different methods to predict close contacts in the representative X-ray structures of an additional 150 protein families using only experimental MSAs.

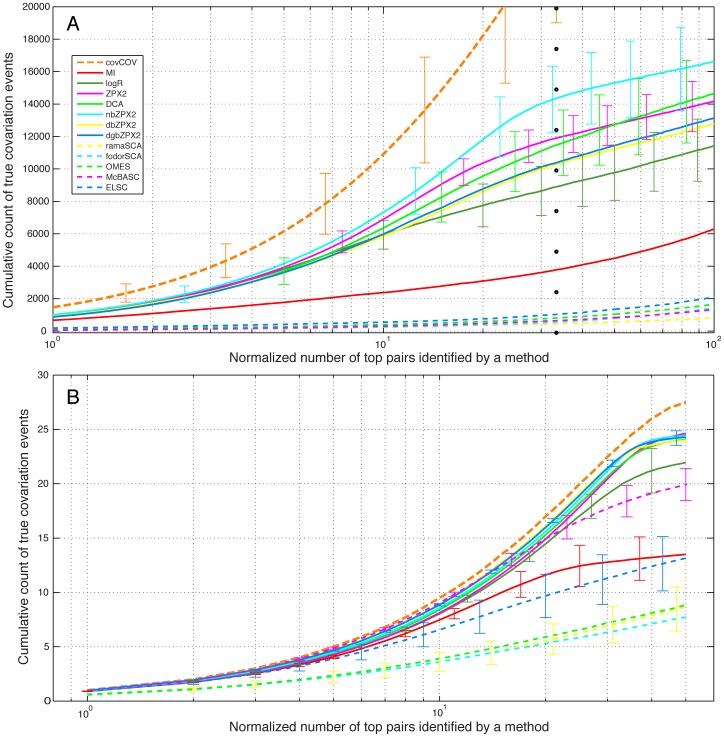
Conclusions/significance: Methods based on the identification of global correlations between pairs were found to be generally superior to methods based only on local correlations in their capacity to identify coevolving residues using either simulated or experimental MSAs. However, the significant variability in the performance of different methods with different proteins suggests that the simulation of MSAs that replicate the statistical properties of the experimental MSA can be a valuable tool to identify the coevolution detection method that is most effective in each case.


Conflict of interest statement

Competing Interests: The authors have declared that no competing interests exist.

Figures

Figure 1
Figure 1. The differential binary (db) method.
A. Resorting of the MSA and differential binary translations. The upper half of the panel shows the same 10 sequences in three different orders. The lower half of the panel shows the corresponding differential binary translations, with the values of the sums highlighted in red. The order of sequences on the left produces the highest sum ( = 100) after differential binary translation. The order in the middle produces an intermediate value ( = 74) of the sum, while the order on the right produces the smallest possible sum ( = 49) of any resorting of the sequences. B. Entropy changes in the binary translations of a simulated MSA of KDO8P synthase. The first point in the plot is the mean entropy <H(i+j)> = <H(i)+H(j)> of the unsorted binary MSA. The remaining points are the values of the same quantity in each of the 300 possible binary MSAs obtained by first resorting the original MSA, using in each case a different reference sequence (which is assigned a value of 0 in all the positions). C. Same as B but reporting on the mean joint entropy <H(i,j)> of all possible pairs. D. Mean mutual information <MI(i;j)> = <H(i)+H(j)−H(i,j)> for all possible pairs.
Figure 2
Figure 2. The normal/binary (nb) method.
The upper half of the panel shows the same 10 sequences in three different orders. The lower half of the panel shows the corresponding normal/binary translations. The number of non-zero elements and the mean MI of the normal/binary alignments are highlighted in red and green, respectively. The reaches its lowest values only when the number of non-zero elements is fully minimized.
Figure 3
Figure 3. Coevolution matrices derived from a simulated MSA.
totCOV: total count of all coevolution events. Although this matrix is built independently during the simulated evolution of the MSA from a single ancestor, it can also be obtained as the sum of the mutCOV, covCOV, and recCOV matrices (see below). Residue pairs under coevolution constraint (true covarions) are indicated by red circles. mutCOV: count of coevolution events due to random point mutations at positions that are not set to coevolve. recCOV: count of coevolution events due to recombination. This count includes residues pairs that are true covarions. covCOV: count of true covarions. There are counts also at pairs of positions that were not set to be covarying because when two or more covarion pairs mutate and segregate also the cross-counts between pairs are added.
Figure 4
Figure 4. Averaged results for 8 protein families with simulated MSAs under 500 sequences.
Cumulative count of covariation events corresponding to the top scoring pairs in the coevolution matrices generated by different methods. A. MSAs simulated with MSAvolve: a dotted vertical line marks the total number of true covarying pairs controlled by the program (as shown in Table 1). B. MSAs simulated with SIMPROT: in these simulations a total number of 50 covarying pairs was used regardless of the sequence length. Since each curve of the two panels is not the average of independent replicas of the same experiment, traditional standard deviation (std) has no meaning in this case. The error bars for selected points i represent a weighted std (wσi) calculated as follows:formula image.
Figure 5
Figure 5. Averaged results for 8 protein families with experimental MSAs under 500 sequences.
Each panel shows the percentage in the top coevolving pairs identified by each method, among the residue pairs separated by less than 8 Å in the X-ray structure of each protein. The abscissa scale is normalized in such a way that 100 corresponds to a number of pairs equal to the number of residues in the sequence. In the top left panel all protein pairs are considered, including those represented by consecutive residues in the sequence. In the top right panel only pairs whose residues are separated by at least 5 intervening positions in sequence space are considered. In the bottom left and bottom right panels only pairs whose residues are separated by at least 10 and 20 intervening positions in sequence space are considered.
Figure 6
Figure 6. Averaged results for 150 protein families with experimental MSAs larger than 1000 sequences.
The meaning of each panel is the same as in Figure 5.
Figure 7
Figure 7. Execution (CPU) time of different coevolution detection methods for the experimental MSA of PHBH (183 seq.×394 aa.).

Similar articles

Cited by

References

    1. Wollenberg KR, Atchley WR (2000) Separation of phylogenetic and functional associations in biological sequences by using the parametric bootstrap. Proc Natl Acad Sci U S A 97: 3288–3291. - PMC - PubMed
    1. Atchley WR, Wollenberg KR, Fitch WM, Terhalle W, Dress AW (2000) Correlations among amino acid sites in bHLH protein domains: an information theoretic analysis. Mol Biol Evol 17: 164–178. - PubMed
    1. Sigala PA, Kraut DA, Caaveiro JM, Pybus B, Ruben EA, et al. (2008) Testing geometrical discrimination within an enzyme active site: constrained hydrogen bonding in the ketosteroid isomerase oxyanion hole. J Am Chem Soc 130: 13696–13708. - PMC - PubMed
    1. Fares MA, Travers SA (2006) A novel method for detecting intramolecular coevolution: adding a further dimension to selective constraints analyses. Genetics 173: 9–23. - PMC - PubMed
    1. Horner DS, Pirovano W, Pesole G (2008) Correlated substitution analysis and the prediction of amino acid structural contacts. Brief Bioinform 9: 46–56. - PubMed

Publication types