Comparative Study
. 2013 Mar;25(3):421-35.
doi: 10.1162/jocn_a_00292. Epub 2012 Oct 23.

A differentiation account of recognition memory: evidence from fMRI

Affiliations
Comparative Study

A differentiation account of recognition memory: evidence from fMRI

Amy H Criss et al. J Cogn Neurosci. 2013 Mar.

Abstract

Differentiation models of recognition memory predict a strength-based mirror effect in the distributions of subjective memory strength. Subjective memory strength should increase for targets and simultaneously decrease for foils following a strongly encoded list compared with a weakly encoded list. An alternative explanation for the strength-based mirror effect is that participants adopt a stricter criterion following a strong list than a weak list. Behavioral experiments support the differentiation account. The purpose of this study was to identify the neural bases for these differences. Encoding strength was manipulated (strong, weak) in a rapid event-related fMRI paradigm. To investigate the effect of retrieval context on foils, foils were presented in test blocks containing strong or weak targets. Imaging analyses identified regions in which activity increased faster for foils tested after a strong list than a weak list. The results are interpreted in support of a differentiation account of memory and are suggestive that the angular gyrus plays a role in evaluating evidence related to the memory decision, even for new items.


Figures
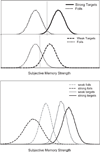
Figure 1
Figure 1
Distributions of memory strength illustrating a criterion shift account of the strength based mirror effect (top panel). Distributions generated from a differentiation model showing that the memory strength of targets and foils differs for strong and weak lists (bottom panel).
Figure 2
Figure 2
Corrected retrieval success map, projected onto inflated cortical surfaces. Lateral view of the left and right hemispheres are in the first and second row, respectively. Top row right side shows a dorsal view of both hemispheres. Bottom row right side shows a medial view of the left hemisphere. The reliability of activation is indicated by the scale bar, in z-score units. L = left; AG= angular gyrus; Cun = cuneus; MFG = middle frontal gyrus; PCC = posterior cingulate cortex; Pre = precuneus; Thal = thalamus.
Figure 3
Figure 3
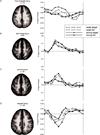
Timecourses of the BOLD response for a subset of the retrieval success areas. Percent signal change from baseline is plotted over 12 time points from stimulus onset for the four classes of stimuli.
Figure 4
Figure 4
The two panels in a show the correlation between activity in left angular gyrus and measures of performance. Discrimination, (d’; left panel) and bias (c; middle panel) are plotted as a function of RSE (HR-CR percent signal change) for each individual participant. The RSE is correlated with d’ but not c. Panel b shows the magnitude of activation early (averaged over timepoints 2 and 3) and at peak (averaged over timepoints 4, 5, and 6) in AG. Differences between strong-list and weak-list foils early in the time course indicate differences in the rate of evidence accumulation, consistent with differentiation models.
Figure 5
Figure 5
The region of interest derived from O’Connor and colleagues (2010) is shown in green, overlaid with the retrieval success ROIs (red) onto an inflated cortical surface. The bottom row plot d’ (left) and c (right) as a function of RSE (HR-CR percent signal change) from the O’Connor ROI. Each data point represents values from a single subject. c but not d’ is correlated with RSE in this ROI, replicating the O’Connor et al finding.
Figure 6
Figure 6
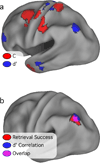
Significant and corrected voxelwise correlations with c (red) and d’ (blue) are overlaid onto an inflated cortical surface of the left hemisphere (top panel). The overlap between activations in or near the AG from the retrieval success (red), d’ voxelwise correlation (blue) and analyses is shown in the bottom panel. Areas of overlap are in violet.

Similar articles

Cited by

References

    1. Aminoff E, Freeman S, Clewett D, Tipper C, Frithsen A, Johnson A, Grafton S, Miller M. Neural correlates of criterion shifting in memory. Poster presented at the Cognitive Neuroscience Meeting; San Francisco, CA. 2011.
    1. Balota DA, Yap MJ, Cortese MJ, Hutchinson KA, Kessler B, Neely JH, Nelson DL, Simpson GB, Treiman R. The English lexicon project. Behavior Research Methods. 2007;39:445–449. - PubMed
    1. Berryhill ME, Phuong L, Picasso L, Cabeza R, Olson IR. Parietal lobe and episodic memory: bilateral damage causes impaired free recall of autobiographical memories. The J Neurosci. 2007;27:14415–14423. - PMC - PubMed
    1. Buckner RL, Wheeler ME. The cognitive neuroscience of remembering. Nat Rev Neurosci. 2001;2:624–634. - PubMed
    1. Buracas GT, Boynton GM. Efficient design of event-related fMRI experiments using M-sequences. Neuroimage. 2002;16:801–813. - PubMed

Publication types