. 2012 Oct 23;5(247):ra77.
doi: 10.1126/scisignal.2003199.

Akt phosphorylates the transcriptional repressor bmi1 to block its effects on the tumor-suppressing ink4a-arf locus

Affiliations

Akt phosphorylates the transcriptional repressor bmi1 to block its effects on the tumor-suppressing ink4a-arf locus

Yan Liu et al. Sci Signal. .

Abstract

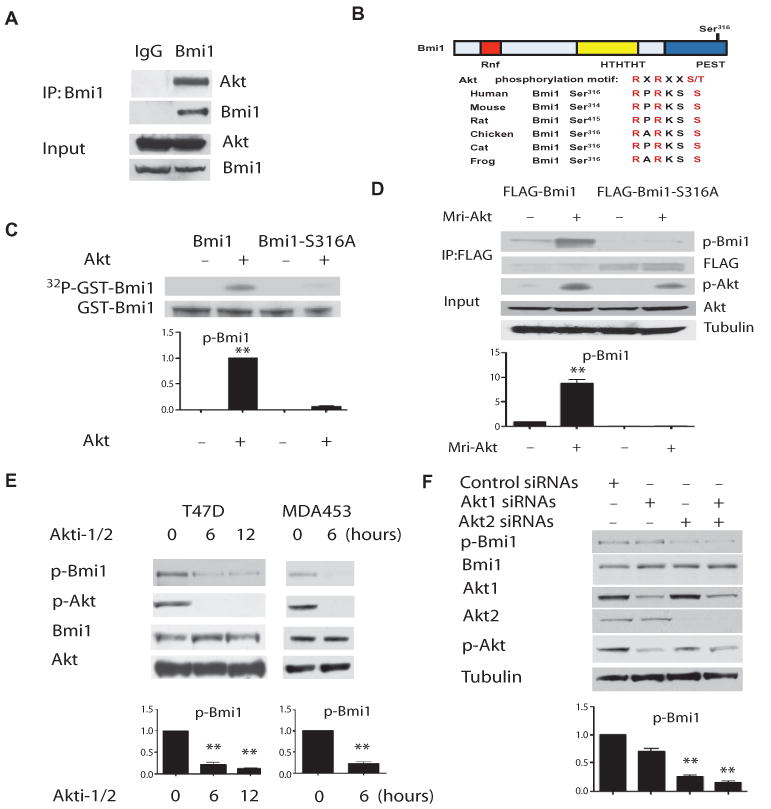
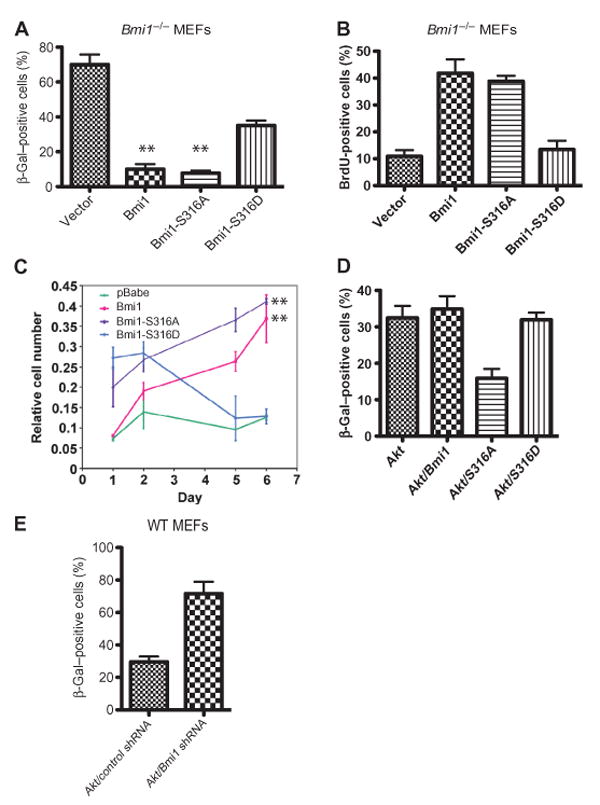
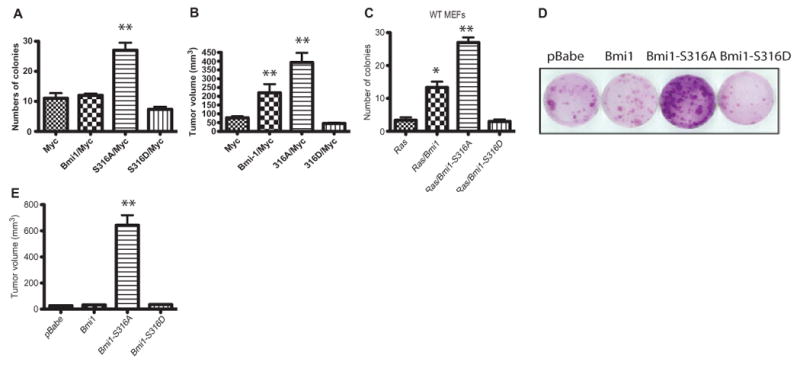
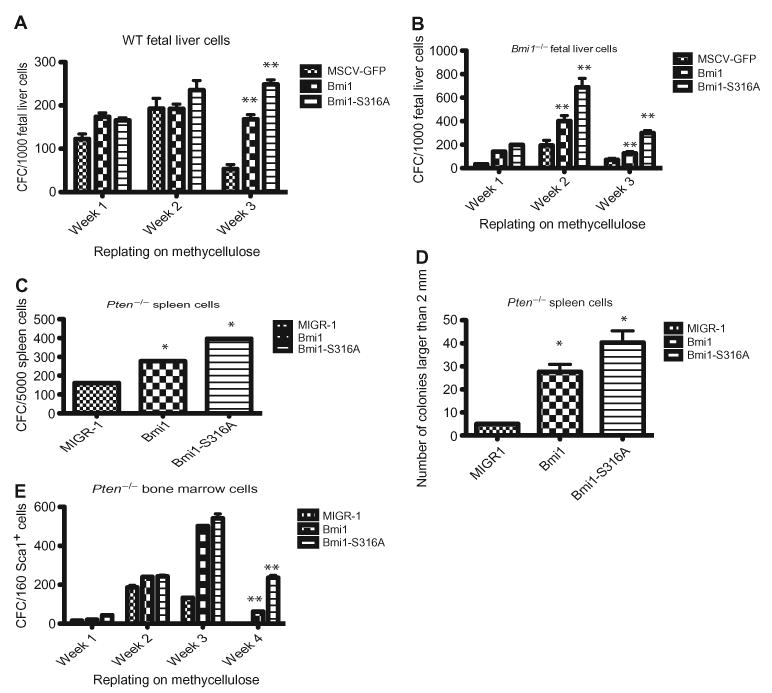
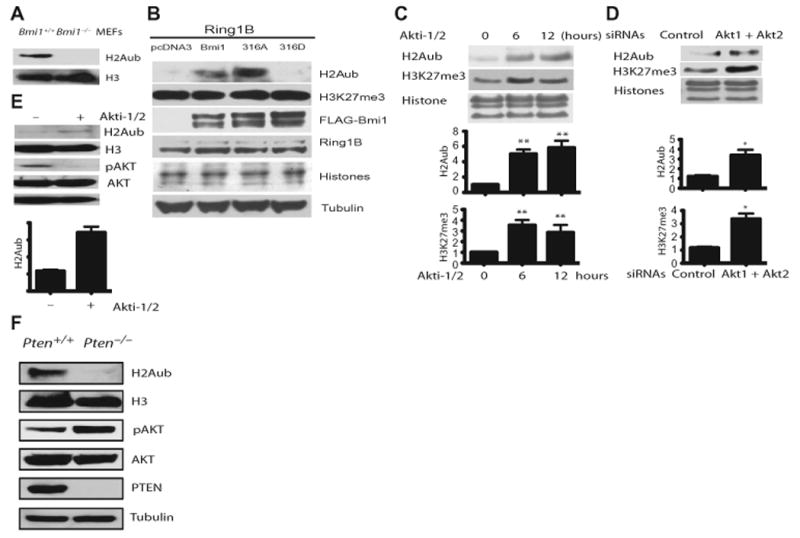
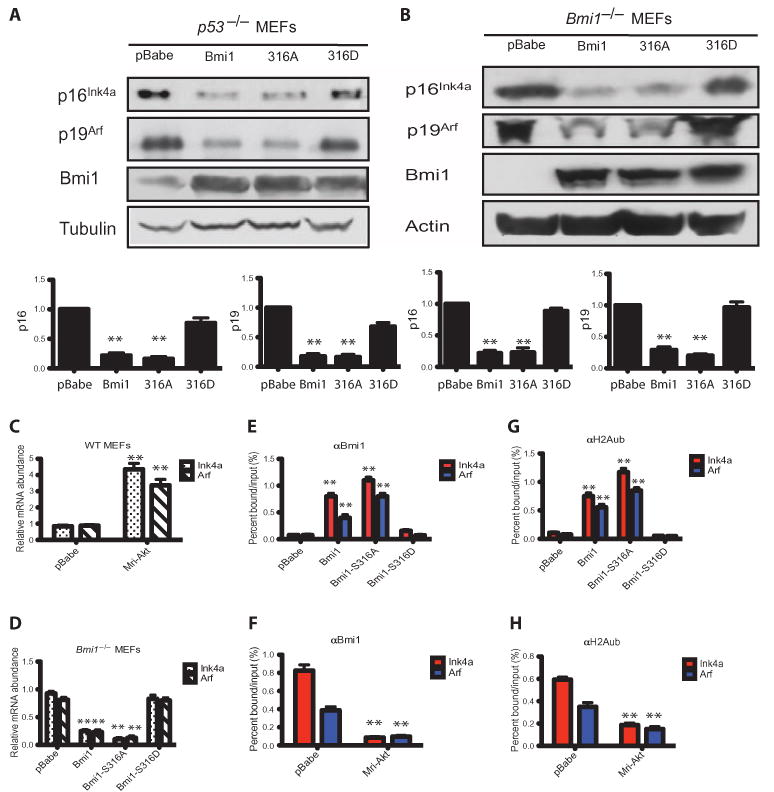
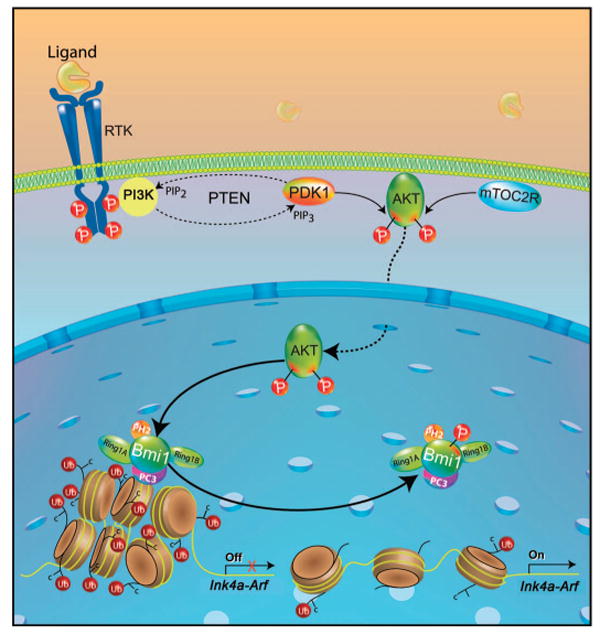
The Polycomb group protein Bmi1 is a transcriptional silencer of the Ink4a-Arf locus, which encodes the cell cycle regulator p16(Ink4a) and the tumor suppressor p19(Arf). Bmi1 plays a key role in oncogenesis and stem cell self-renewal. We report that phosphorylation of human Bmi1 at Ser³¹⁶ by Akt impaired its function by triggering its dissociation from the Ink4a-Arf locus, which resulted in decreased ubiquitylation of histone H2A and the inability of Bmi1 to promote cellular proliferation and tumor growth. Moreover, Akt-mediated phosphorylation of Bmi1 also inhibited its ability to promote self-renewal of hematopoietic stem and progenitor cells. Our study provides a mechanism for the increased abundance of p16(Ink4a) and p19(Arf) seen in cancer cells with an activated phosphoinositide 3-kinase to Akt signaling pathway and identifies crosstalk between phosphorylation events and chromatin structure.


Conflict of interest statement

Competing interests: The authors declare that they have no competing interests.

Figures

Fig. 1
Fig. 1
Akt phosphorylates Bmi1 at Ser316. (A) Bmi1 associates with endogenous Akt in HeLa cells, as detected by immunoprecipitation and Western blotting (n = 3 sets of cells). (B) A consensus Akt phosphorylation site in Bmi1 (Ser316, indicated in red) is conserved across species. (C) Wild-type (WT) Bmi1, but not Bmi1-S316A, is phosphorylated by recombinant active Akt in vitro. The graph shows the amount of phosphorylated Bmi1 normalized to total Bmi1 and relative to control (no Akt). **P < 0.001 compared with control (no Akt) by one-way analysis of variance (ANOVA) and Bonferroni post hoc test. (D) Bmi1, but not Bmi1-S316A, is phosphorylated by Akt (Mri-Akt) in cells. The graph shows the amount of phosphorylated Bmi1 normalized to total Bmi1 and relative to control (no Mri-Akt). **P < 0.001 compared with control (no Mri-Akt) by one-way ANOVA and Bonferroni post hoc test. (E) Endogenous Bmi1 is phosphorylated by Akt at Ser316 in cells. The graph shows the amount of phosphorylated Bmi1 (normalized to total Bmi1) relative to time 0. **P < 0.001 compared with time 0 by one-way ANOVA and Dunnett's post hoc test. (F) Knockdown of Akt1 and Akt2 decreases the phosphorylation of Bmi1 on Ser316. The graph shows the amount of phosphorylated Bmi1 normalized to total Bmi1 and relative to control siRNA sample. **P < 0.001 compared with control siRNA sample by one-way ANOVA and Bonferroni post hoc test. Data represent at least three independent experiments.
Fig. 2
Fig. 2
Phosphorylation of Bmi1 by Akt suppresses its effects on cell proliferation and senescence. (A) Premature senescence of Bmi1−/− MEFs is rescued by the WT Bmi1 and the Bmi1-S316A mutant but not by the Bmi1-S316D mutant. **P < 0.001 compared with pBabe-transduced MEFs by one-way ANOVA and Bonferroni post hoc test. (B) BrdU incorporation into passage 3 Bmi1−/− MEFs, infected at passage 1 with the indicated retroviruses. **P < 0.001compared with pBabe-transduced MEFs by one-way ANOVA and Bonferroni post hoc test. (C) The impaired proliferation of Bmi1−/− MEFs is rescued by WT Bmi1 and Bmi1-S316A but not byBmi1-S316D. **P < 0.001 compared with pBabe-transduced MEFs by two-way ANOVA. (D) Premature senescence of WT MEFs expressing activated Akt is rescued by the Bmi1-S316A mutant but not by the WT Bmi1 or the Bmi1-S316D mutant. **P < 0.001 compared to all other samples by one-way ANOVA and Bonferroni post hoc test. (E) Premature senescence of WT MEFs expressing activated Akt is enhanced by silencing Bmi1. P < 0.01 compared with control short hairpin RNA (shRNA) sample by t test. Data represent at least three independent experiments.
Fig. 3
Fig. 3
Phosphorylation of Bmi1 by Akt suppresses its effects on cellular transformation. (A) Soft agar transformation assay of p53−/− MEFs infected with WT Bmi1 or Bmi1 mutants in combination with Myc. A representative experiment performed as biological triplicates is shown along with SDs. **P < 0.001 compared to all other samples by one-way ANOVA and Bonferroni post hoc test. (B) WT Bmi1 and Bmi1-S316A mutant, but not Bmi1-S316D mutant, cooperate with Myc in the neoplastic transformation of p53−/− MEFs. **P < 0.001 compared to all other samples by one-way ANOVA and Bonferroni post hoc test. (C) Soft agar transformation assay of WT MEFs infected with the WT Bmi1 or the Bmi1-S316A mutant in combination with activated Ras (H-RasG12D). A representative experiment, performed as biological triplicates, is shown along with SDs. **P < 0.001 compared to all other samples by one-way ANOVA and Bonferroni post hoc test. (D) Bmi1-S316A mutant enhances focus formation by p53−/− MEFs. (E) Bmi1-S316A mutant promotes the growth of tumors formed from p53−/− MEFs in nude mice. **P < 0.001 compared to all other samples by one-way ANOVA and Bonferroni post hoc test. Data represent at least three independent experiments.
Fig. 4
Fig. 4
Akt-mediated phosphorylation of Bmi1 inhibits hematopoietic progenitor cell self-renewal. (A) Myeloid progenitors were quantified by methycellulose culture using WT fetal liver cells transduced with retroviruses expressing the WT or the Bmi1-S316A mutant. **P < 0.001 compared with murine stem cell virus (MSCV)–GFP–transduced fetal liver cells by two-way ANOVA. (B) Myeloid progenitors were quantified by methycellulose culture using Bmi1−/− fetal liver cells transduced with retroviruses expressing the WT or the Bmi1-S316A mutant.Mean values (±SD) are shown (n = 3 independent experiments). **P < 0.001 compared with MSCVGFP– transduced fetal liver cells by two-way ANOVA. (C)Pten−/− spleen cells were transduced with retroviruses expressing the WT or the S316A mutant form of Bmi1. Data are means ± SD (n = 3 independent experiments). *P < 0.01 compared with MIGR1- transduced spleen cells by one-way ANOVA and Bonferroni post hoc test. (D) The size of themyeloid colonies formed in (C) was measured. Data are means ± SD (n = 3 independent experiments). *P < 0.01 compared with MIGR1-transduced spleen cells by one-way ANOVA and Bonferroni post hoc test. (E) Myeloid progenitors were quantified by methycellulose culture using Pten−/− fetal liver cells transduced with retroviruses expressing the WT or the S316A mutant form of Bmi1.Mean values (±SD) are shown (n=3 independent experiments). **P < 0.001 compared with MIGR1-transduced bone marrow cells by two-way ANOVA. Data represent at least three independent experiments.
Fig. 5
Fig. 5
PI3K-Akt signaling pathway inhibits H2A ubiquitination. (A) Western blot analysis of H2A ubiquitination in WT and Bmi1−/−MEFs. (B) Western blot analysis of the ubiquitination of histone H2A in U2OS cells transfected with Ring1B and either an empty vector or a vector expressing the WT Bmi1 or the Bmi1 mutant proteins (n = 3 independent experiments). (C) Akt inhibits H2A ubiquitination. The top graph shows the amount of ubiquitinated H2A normalized to total H2A and relative to time 0. The bottom graph shows the amount of H3K27me3 normalized to total H3K27 and relative to time 0. **P < 0.001 compared with time 0 by one-way ANOVA and Dunnett's post hoc test. (D)Western blot analysis of histone H2A ubiquitination and H3K27me3 amounts in T47D cells transfected with control siRNA or Akt1 and Akt2 siRNAs shows increased H2A ubiquitination. The top graph shows the amount of ubiquitinated H2A normalized to total H2A and relative to control siRNA sample. The bottom graph shows the amount of H3K27me3 normalized to total H3K27 and relative to control siRNA sample. Unpaired t test, *P < 0.01. n = 3 independent experiments. (E) Western blot analysis of ubiquitination of histone H2A in WT MEF cells treated with Akti-1/2 shows increased H2A ubiquitination at 12 hours. The graph shows the amount of ubiquitinated H2A normalized to total H2A and relative to control sample (no Akti-1/2). Unpaired t test, **P < 0.001. n = 3 independent experiments. (F) Western blot analysis of H2A ubiquitination in WT and Pten−/− MEFs. Data represent at least three independent experiments.
Fig. 6
Fig. 6
PI3K-Akt signaling inhibits the association of Bmi1 with the Ink4a-Arf locus. (A) WT Bmi1 and Bmi1-S316A mutant, but not Bmi1-S316D mutant, decrease the abundance of p16Ink4a and p19Arf in p53−/− MEFs. The graph shows the amount of p16 or p19 normalized to tubulin and relative to pBabe-transduced MEFs. **P < 0.001 compared with pBabe-transduced MEFs by one-way ANOVA and Bonferroni post hoc test. n = 3 independent experiments. (B) The increased abundance of p16Ink4a and p19Arf proteins in Bmi1−/− MEFs is rescued by expression of the WT Bmi1 and the Bmi1-S316A mutant but not by the Bmi1-S316D mutant. The graph shows the amount of p16 or p19 normalized to tubulin and relative to pBabe-transduced MEFs. **P < 0.001 compared with pBabe-transduced MEFs by one-way ANOVA and Bonferroni post hoc test. n = 3 independent experiments. (C) Quantitative reverse transcription polymerase chain reaction (qRT-PCR) analysis of Ink4a and Arf mRNA abundance in WT MEFs expressing constitutively active Akt. **P < 0.001 compared with pBabe-transduced MEFs by one-way ANOVA and Bonferroni post hoc test. n = 3 independent experiments. (D) qRT-PCR analysis of Ink4a and Arf mRNA abundance in cells from (B). **P < 0.001 compared with pBabe-transduced MEFs by one-way ANOVA and Bonferroni post hoc test. n = 3 independent experiments. (E) ChIP analysis of the Ink4a-Arf locus using an anti-Bmi1 antibody and cells from (B). **P < 0.001 compared with pBabe-transduced MEFs by one-way ANOVA and Bonferroni post hoc test. n = 3 independent experiments. (F) ChIP analysis of the Ink4a-Arf locus using an anti-Bmi1 antibody and cells from (C). **P < 0.001 compared with pBabe-transduced MEFs by two-way ANOVA. n = 3 independent experiments. (G) ChIP analysis of the Ink4a-Arf locus using an anti-H2Aub antibody and cells from (B). **P < 0.001 compared with pBabe-transduced MEFs by two-way ANOVA. n = 3 independent experiments. (H) ChIP analysis of the Ink4a-Arf locus using an anti-H2Aub antibody and cells from (C). **P < 0.001 compared with pBabe-transduced MEFs by two-way ANOVA. n = 3 independent experiments.
Fig. 7
Fig. 7
Bmi1 basally associates with chromatin and maintains the Ink4a-Arf locus in a silenced state. In response to PI3K-Akt signaling, Akt phosphorylates Bmi1 on Ser316, leading to its dissociation from chromatin and to derepression of the Ink4a-Arf locus. RTK, receptor tyrosine kinase.

Similar articles

Cited by

References

    1. Valk-Lingbeek ME, Bruggeman SW, van Lohuizen M. Stem cells and cancer: The Polycomb connection. Cell. 2004;118:409–418. - PubMed
    1. Sparmann A, van Lohuizen M. Polycomb silencers control cell fate, development and cancer. Nat Rev Cancer. 2006;6:846–856. - PubMed
    1. Pietersen AM, van Lohuizen M. Stem cell regulation by polycomb repressors: Postponing commitment. Curr Opin Cell Biol. 2008;20:201–207. - PubMed
    1. Cao R, Wang L, Wang H, Xia L, Erdjument-Bromage H, Tempst P, Jones RS, Zhang Y. Role of histone H3 lysine 27 methylation in Polycomb-group silencing. Science. 2002;298:1039–1043. - PubMed
    1. Wang H, Wang L, Erdjument-Bromage H, Vidal M, Tempst P, Jones RS, Zhang Y. Role of histone H2A ubiquitination in Polycomb silencing. Nature. 2004;431:873–878. - PubMed

Publication types

MeSH terms