Comparative Study
. 2012 Nov 29;53(12):7889-95.
doi: 10.1167/iovs.12-10765.

The IS/OS junction layer in the natural history of type 2 idiopathic macular telangiectasia

Collaborators, Affiliations
Comparative Study

The IS/OS junction layer in the natural history of type 2 idiopathic macular telangiectasia

Ferenc B Sallo et al. Invest Ophthalmol Vis Sci. .

Abstract

Purpose: To document the progression of a break in the photoreceptor inner segment/outer segment (IS/OS) junction layer and its functional correlates over time in the natural history of type 2 idiopathic macular telangiectasia (type 2 MacTel).

Methods: Patients with at least 1 year of follow-up were selected from the MacTel Study. En face images were created by manual segmentation of the IS/OS junctional line in volume scans acquired using a spatial-domain optical coherence tomography retinal imaging unit. Retinal sensitivity thresholds were determined using a retinal microperimeter unit. Aggregate retinal sensitivity loss within IS/OS lesions was calculated. Changes over time in an area of IS/OS defects and retinal sensitivity were analyzed.

Results: thirty-nine eyes of 23 patients (mean age: 62.3 ± 9.2 years) were analyzed. Mean follow-up time was 1.9 years (range: 1-3 years). Mean IS/OS break area at baseline was 0.575 mm(2) (SE = 0.092, 95% confidence interval [CI]: 0.394-0.756 mm(2)). The cluster-adjusted mean annual progression rate in IS/OS break area was 0.140 mm(2) (SE = 0.040, 95% CI: 0.062-0.218 mm(2), P < 0.001). Mean aggregate retinal sensitivity loss was at baseline 28.56 dB (SE = 5.43, 95% CI: 17.32-39.80 dB, n = 28), a positive correlation with IS/OS lesion area was present (P < 0.001). The mean annual rate of change in aggregate sensitivity loss was 5.14 dB (SE = 1.51, 95% CI: 2.19-8.10 dB, P < 0.001, n = 37), a significant correlation with lesion area increase was found (P = 0.006).

Conclusions: Both IS/OS break area and rate of enlargement correlate with aggregate retinal sensitivity loss in type 2 MacTel. En face OCT imaging of the IS/OS layer provides a functionally relevant method for documenting disease progression in type 2 MacTel.


Conflict of interest statement

Disclosure: F.B. Sallo, None; T. Peto, None; C. Egan, None; U.E.K. Wolf-Schnurrbusch, None; T.E. Clemons, None; M.C. Gillies, None; D. Pauleikhoff, None; G.S. Rubin, None; E.Y. Chew, None; A.C. Bird, None

Figures

Figure 1
Figure 1
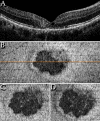
The IS/OS lesion en face and corresponding B-scan, progression of the lesion size, and structure over time. (A) Sample B-scan of a type 2 MacTel eye; an orange line marks its location within the en face image in (B). In (A), note the sharp boundary on the left edge and the irregular attenuation of the IS/OS line on the right side, corresponding within the en face image to a distinct boundary in the left and inferior part and a gradual, patchy thinning in the superior and right part of the break, respectively. (B) Within the en face image, the IS/OS break appears as a darker area against the background of the highly reflective IS/OS layer. Internal to the edges of the lesion areas with a reflectivity similar to that of the IS/OS are also apparent. These may correspond to islands of preserved IS/OS, but more frequently to the cross-section of an area with pathologic vertical restructuring of the retina where retinal layers between the outer plexiform layer and the RPE seem to be absent and the disorganized outer plexiform layer and layers interior to it give the impression of “collapsing” onto the RPE (see [A]). (BD) En face images from 2007, 2009, and 2011. Progression in area occurs both along the distinct edge as well as through gradual thinning of the IS/OS (top right edge). “Collapsed” layers in cross-section appear to increase in area as well as optical density. RPE, retinal pigment epithelium.
Figure 2
Figure 2
Progression of the IS/OS break in 2 years. Within the area of the IS/OS break, insular variations of backscatter may be present. Low optical density corresponds to the cross-sections of outer retinal atrophic cavities, a high reflectivity to cross-sections of an abnormal retinal tissue with a vertical orientation. In these, retinal layers between the outer plexiform layer and the RPE seem to be absent and the structurally disorganized remaining retinal layers give the impression of “collapsing” onto the RPE. This structure was always seen initially on the temporal side of the foveal center., Islands of preserved IS/OS may also present as areas with high reflectivity. Images on the left were taken in 2008, on the right in 2010. Orange lines mark the position of respective B-scan within the en face image. (B, D) In the en face images, a significant increase in break area is accompanied by a reduction in the area of the cross-sections of the outer retinal empty spaces (near-black areas) and the enlargement of a highly reflective area corresponding in B-scans (A, C) to outer retinal atrophy and a pathologic vertical restructuring of the retina. (F, H) Although the overall increase in the break area is minor, the progression of retinal restructuring is detectable in the en face image, the shape of the outer empty space changes, and the area and optical density of the collapsed layers increase (compare with [E] and [G]).
Figure 3
Figure 3
Abnormal shape of the IS/OS junction layer without a manifest break. OCT images of a type 2 MacTel eye. (A) B-scan showing a large inner retinal cyst with signs of elevated internal pressure, deforming the surface contour of the retina. The IPL is laterally displaced; the OPL, ONL, external limiting membrane, and IS/OS line deviate toward the RPE within the area of the fovea interna, in line with the cyst. (B) With respect to the en face image of the IS/OS layer, a break is not detectable. An irregular area around the foveal center shows attenuated backscatter. An orange line marks the position of the B-scan in (A). (D) The volume of the inner retinal cyst (rendered in blue), superimposed over the en face image. (C) 3D perspective view of the IS/OS layer and the inner cyst, a large part of the fovea interna is sunken toward the RPE; this corresponds directly to the location of the cyst. A similar deformation of the IS/OS may also accompany an IS/OS break. (Darker horizontal striping is due to an artifactual variation in B-scan intensity.)
Figure 4
Figure 4
Focal lateral contraction of the retina temporal of the foveal center in type 2 MacTel. (A) In 2008, in an early-phase FA image, dilated veins from the superior and inferior temporal branches and a dilated deep capillary plexus are evident. (B) By 2010, pigment appears, the retina around it contracts, radial vessels straighten, and point toward the tissue surrounding the pigment deposit. (C) The tissue corresponds in the en face OCT image to the cross-section of “collapsed” layers.
Figure 5
Figure 5
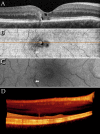
Collapsed” retinal layers with indications of vascular involvement. (A) B-scan OCT image. (B) OCT en face image of the IS/OS junction layer; an orange line marks the location of the B-scan in image (A); a white arrow marks a dilated vein. (C) Red-free image of the same retinal location. The cross-section of the collapsing layers colocalizes with the tip of a dilated vein (arrow) that changes caliber abruptly. (D) 3D perspective rendering of the OCT data; note the sunken appearance of the IS/OS layer around the break in the temporal part of the fovea externa and the vertical, optically dense tissue extending between the inner and outer layers.

References

    1. Gass JD, Oyakawa RT. Idiopathic juxtafoveolar retinal telangiectasis. Arch Ophthalmol. 1982; 100: 769– 780. - PubMed
    1. Gass JD, Blodi BA. Idiopathic juxtafoveolar retinal telangiectasis. Update of classification and follow-up study. Ophthalmology. 1993; 100: 1536– 1546. - PubMed
    1. Gaudric A, Ducos de Lahitte G, Cohen SY, Massin P, Haouchine B. Optical coherence tomography in group 2A idiopathic juxtafoveolar retinal telangiectasis. Arch Ophthalmol. 2006; 124: 1410– 1419. - PubMed
    1. Yannuzzi LA, Bardal AM, Freund KB, Chen KJ, Eandi CM, Blodi B. Idiopathic macular telangiectasia. Arch Ophthalmol. 2006; 124: 450– 460. - PubMed
    1. Maruko I, Iida T, Sekiryu T, Fujiwara T. Early morphological changes and functional abnormalities in group 2A idiopathic juxtafoveolar retinal telangiectasis using spectral domain optical coherence tomography and microperimetry. Br J Ophthalmol. 2008; 92: 1488– 1491. - PubMed

Publication types