. 2013 Jan;41(Database issue):D1104-14.
doi: 10.1093/nar/gks994. Epub 2012 Oct 23.

The Comparative Toxicogenomics Database: update 2013

Affiliations

The Comparative Toxicogenomics Database: update 2013

Allan Peter Davis et al. Nucleic Acids Res. 2013 Jan.

Abstract

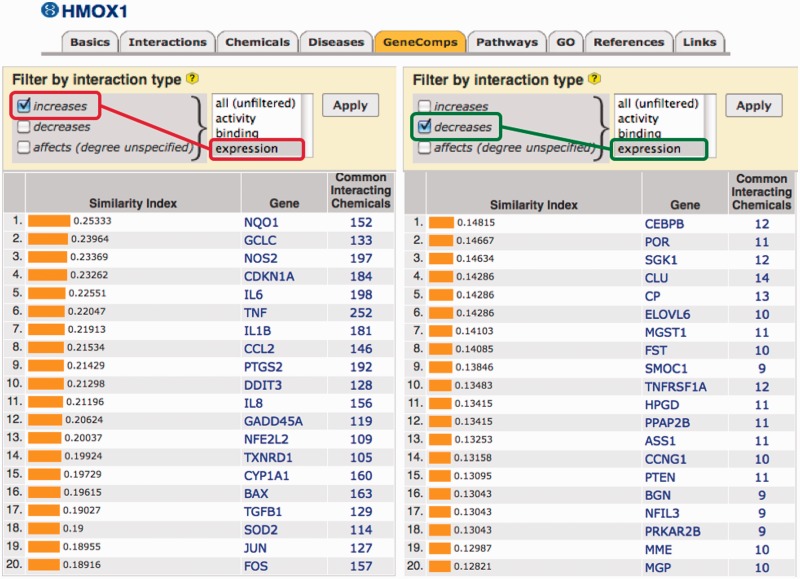
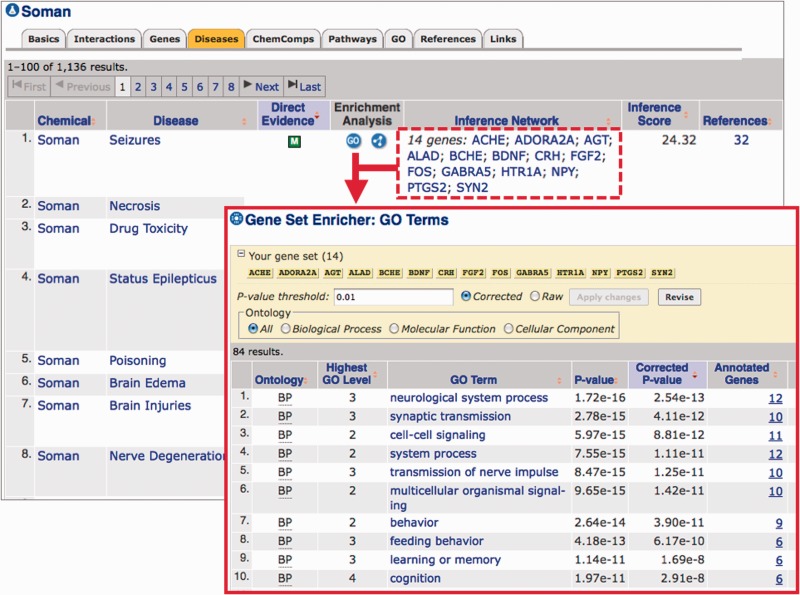
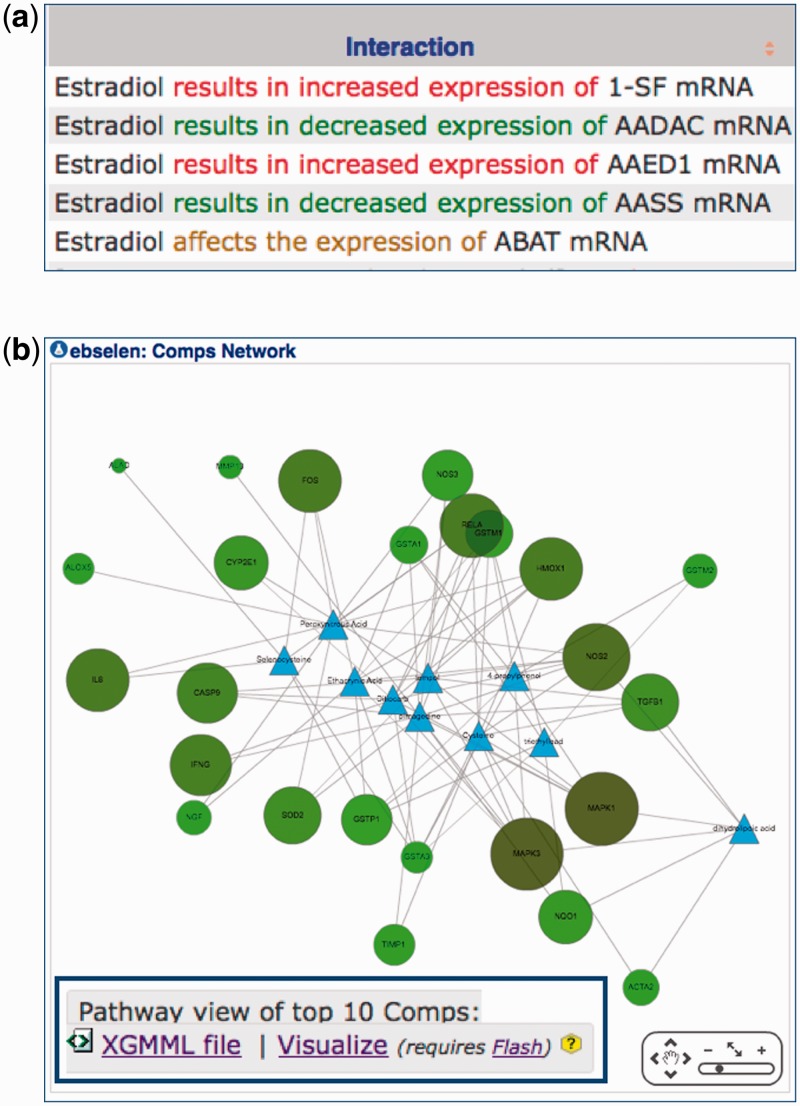
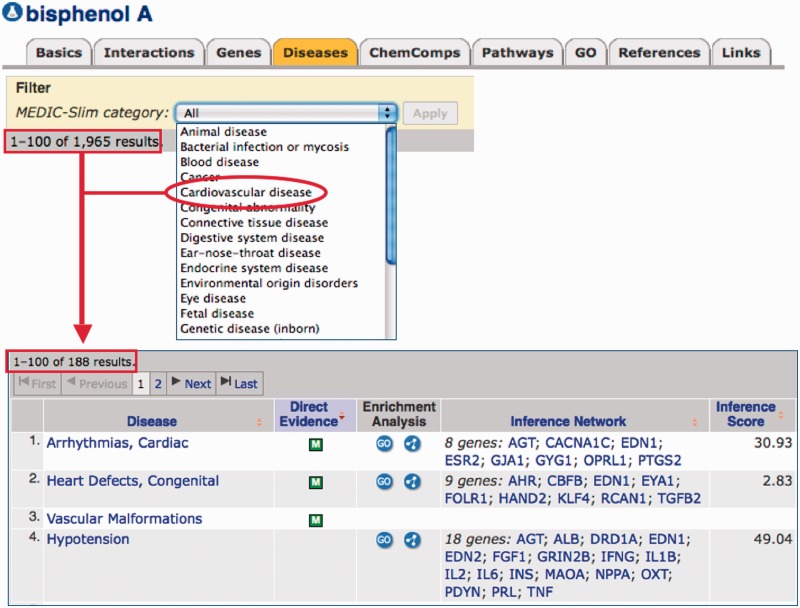
The Comparative Toxicogenomics Database (CTD; http://ctdbase.org/) provides information about interactions between environmental chemicals and gene products and their relationships to diseases. Chemical-gene, chemical-disease and gene-disease interactions manually curated from the literature are integrated to generate expanded networks and predict many novel associations between different data types. CTD now contains over 15 million toxicogenomic relationships. To navigate this sea of data, we added several new features, including DiseaseComps (which finds comparable diseases that share toxicogenomic profiles), statistical scoring for inferred gene-disease and pathway-chemical relationships, filtering options for several tools to refine user analysis and our new Gene Set Enricher (which provides biological annotations that are enriched for gene sets). To improve data visualization, we added a Cytoscape Web view to our ChemComps feature, included color-coded interactions and created a 'slim list' for our MEDIC disease vocabulary (allowing diseases to be grouped for meta-analysis, visualization and better data management). CTD continues to promote interoperability with external databases by providing content and cross-links to their sites. Together, this wealth of expanded chemical-gene-disease data, combined with novel ways to analyze and view content, continues to help users generate testable hypotheses about the molecular mechanisms of environmental diseases.


Figures

Figure 1.
Figure 1.
DiseaseComps finds similar disorders. CTD’s Disease page for autistic disorders contains a ‘DiseaseComps’ data tab that allows users to see similar disorders based upon shared chemicals or genes and either via marker/mechanism or therapeutic relationships. Users can toggle open any of the different representations of the comparable diseases, as shown here for ‘via gene marker/mechanism associations’. In addition to intuitive disorders such as intellectual disability and schizophrenia (the top two comparable diseases identified), it is also discovered that autism shares many genes with non-obvious diseases (red boxes) such as prostatic neoplasms (30 genes), lung neoplasms (17 genes), hypotension (12 genes), obesity (10 genes) and hypertension (11 genes). Clicking on the hyperlinked gene count in the right-hand column opens another window listing the common interacting genes. The Similarity Index is derived from the Jaccard similarity coefficient (22).
Figure 2.
Figure 2.
Filtering GeneComps by type of interaction. CTD users can now filter ChemComps and GeneComps based on the direction and type of interaction, as shown here for gene HMOX1. The panel on the left displays other genes that are comparable to HMOX1 based on filtering for chemicals that increase the expression of the genes (red lariat). The panel on the right, however, produces a different set of comparable genes to HMOX1 based on chemicals that decrease the expression of genes (green lariat). Users can also filter for activity, binding or all (unfiltered) interaction types.
Figure 3.
Figure 3.
Enrichment analysis of genes in chemical inference networks. CTD’s Chemical page for the nerve agent Soman has the ‘Diseases’ data tab highlighted, listing the diseases to which Soman can be linked (either directly or by an inferred network of genes). By clicking the ‘GO’ button under the ‘Enrichment Analysis’ column for the first listed disease (Seizures), the tool automatically sends the 14 genes listed in the ‘Inference Network’ column (red dashed box) to the Gene Set Enricher tool (red arrow). The results (red inset box) include 84 enriched GO terms associated with these 14 genes. The list can be further revised by selecting corrected versus raw P-values, changing the P-value threshold itself and filtering the results for any of the three GO branches. Similar analysis can be performed for Pathway annotations by clicking the ‘Pathway’ button under the ‘Enrichment Analysis’ column.
Figure 4.
Figure 4.
New visualization at CTD. (a) Manually curated interactions are now color-coded on web pages to rapidly discern between statements that describe an ‘increased’ interaction (red font), a ‘decreased’ interaction (green font) or one in which the directionality is not specified (brown font). (b) The ‘ChemComps’ data tab on a CTD Chemical page provides the option to visualize networks of common interacting genes for the top 10 ranked comparable chemicals using a web version of Cytoscape. The chemicals that form the ChemComps are depicted as blue triangles and the connecting genes are green nodes. The map is customizable by the user (data not shown). For larger networks, XGMML files can be downloaded and used on a desktop platform of Cytoscape (inset).
Figure 5.
Figure 5.
CTD disease landscape. CTD currently contains over 11 million disease relationships (both direct and inferred) for 5987 unique diseases MEDIC-Slim reduces the complexity of this information into 36 generic disease categories (y-axis) to show the overall landscape of disease information at CTD for both direct relationships (blue bars) and inferred relationships (yellow bars), as a percentage of the total number of relationships.
Figure 6.
Figure 6.
MEDIC-Slim adds functionality, reduces complexity of disease information and eases data management. CTD biocurators use the MEDIC disease vocabulary to curate disease relationships. These MEDIC diseases are now mapped to 36 MEDIC-Slim generic disease categories, which help reduce complexity and add the functionality of allowing users to easily retrieve and manage the information. Under its ‘Diseases’ data tab, the chemical bisphenol A is associated with 1965 diseases (red box). This data set can be filtered for any of the 36 MEDIC-Slim categories from a pick-list, such as ‘Cardiovascular disease’ (red circle), to retrieve only the 188 cardiovascular diseases associated with bisphenol A (red arrow).

Similar articles

Cited by

References

    1. Mortensen HM, Euling SY. Integrating mechanistic and polymorphism data to characterize human genetic susceptiblity for environmental chemical risk assessment in the 21st centruy. Toxicol. Appl. Pharmacol. 2011 February 1. (doi:10.1016/j.taap.2011.01.015; epub ahead of print) - PubMed
    1. Mahadevan B, Snyder RD, Waters MD, Benz RD, Kemper RA, Tice RR, Richard AM. Genetic toxicology in the 21st century: reflections and future directions. Environ. Mol. Mutagen. 2011;52:339–354. - PMC - PubMed
    1. Mattingly CJ, Rosenstein MC, Davis AP, Colby GT, Forrest JN, Boyer JL. The Comparative Toxicogenomics Database: a cross-species resource for building chemical-gene interaction networks. Toxicol. Sci. 2006;92:587–595. - PMC - PubMed
    1. Davis AP, King BL, Mockus S, Murphy CG, Saraceni-Richards C, Rosenstein M, Wiegers T, Mattingly CJ. The Comparative Toxicogenomics Database: update 2011. Nucleic Acids Res. 2011;39:D1067–D1072. - PMC - PubMed
    1. Davis AP, Murphy CG, Saraceni-Richards CA, Rosenstein MC, Wiegers TC, Mattingly CJ. Comparative Toxicogenomics Database: a knowledgebase and discovery tool for chemical-gene-disease networks. Nucleic Acids Res. 2009;37:D786–D792. - PMC - PubMed

Publication types