Comparative Study
. 2013 Jan 7;41(1):474-86.
doi: 10.1093/nar/gks989. Epub 2012 Oct 23.

Comparison of mRNA features affecting translation initiation and reinitiation

Affiliations
Comparative Study

Comparison of mRNA features affecting translation initiation and reinitiation

Ilya A Osterman et al. Nucleic Acids Res. .

Abstract

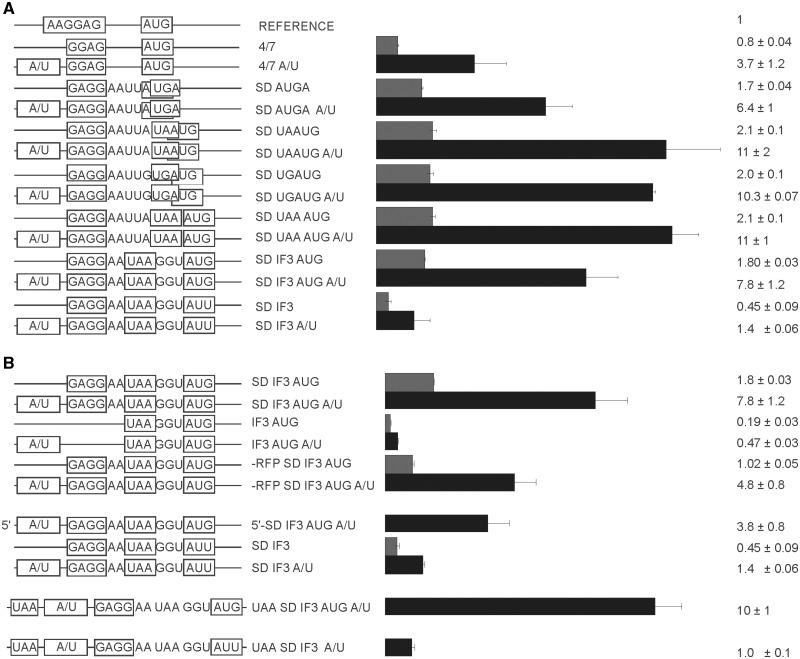
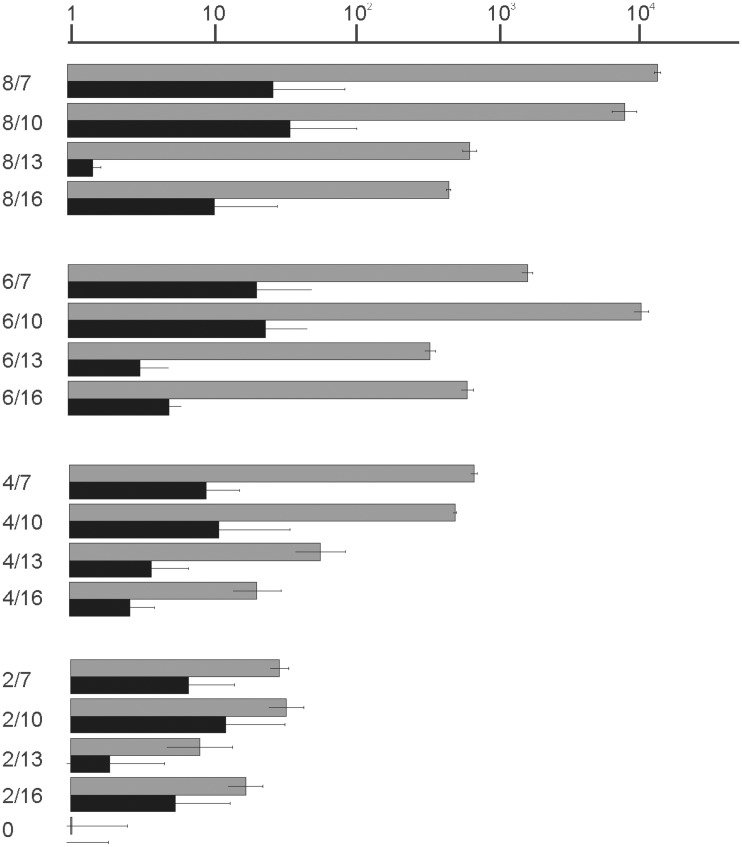
Regulation of gene expression at the level of translation accounts for up to three orders of magnitude in its efficiency. We systematically compared the impact of several mRNA features on translation initiation at the first gene in an operon with those for the second gene. Experiments were done in a system with internal control based on dual cerulean and red (CER/RFP) fluorescent proteins. We demonstrated significant differences in the efficiency of Shine Dalgarno sequences acting at the leading gene and at the following genes in an operon. The majority of frequent intercistronic arrangements possess medium SD dependence, medium dependence on the preceding cistron translation and efficient stimulation by A/U-rich sequences. The second cistron starting immediately after preceding cistron stop codon displays unusually high dependence on the SD sequence.


Figures

Figure 1.
Figure 1.
Influence of the start codon on expression efficiency. (A) Circular diagram of the start codon frequency distribution in the genome of E. coli MG1655 (20). (B) Schematic representation (left side of the panel) and translation efficiencies (right side of the panel) of the constructs. All constructs designations are indicated next to the schematic representations. Translation efficiencies of the CER reporter were normalized to the reference RFP construct (shown on top of the panel) and indicated as a diagram. Exact values are shown next to the corresponding bars. All constructs designations are indicated next to the schematic representations. Actual sequences could be found in Supplementary Table S1.
Figure 2.
Figure 2.
Influence of strength and position of mRNA secondary structure elements in translation initiation region on expression efficiency. (A) Schematic representation (left side of the panel) and translation efficiencies (right side of the panel) of the constructs (similar to those on Figure 1B). All construct designations are indicated next to the schematic representations. Actual sequences could be found in Supplementary Table S1. (B) A plot of mean FE in kcal/mole of all E. coli mRNAs as a function of 40 nt sliding window position relative to the start codon (7). Dots represent the location of the secondary structure elements in the reporter constructs are listed on the panel (A) and marked. (C) Frequency distribution of translation initiation region folding energies in a complete set of E. coli mRNA (7). Dots represent the strength of the secondary structure elements in the reporter constructs are listed on the panel (A) and marked.
Figure 3.
Figure 3.
Influence of SD sequence length and location on expression efficiency. (A) Distribution plot of SD length in basepairs (y-axis) and spacing from aagGagg to the first nucleotide of the start codon (x-axis). Frequency of occurrence of particular variant of translation initation region in the genome of E. coli MG1655 (22) is indicated by a color. The denser is the hue of gray the more frequent is the variant (see the key in the up right corner). Dots on the plot correspond to the constructs tested in this work. (B) Schematic representation (left side of the panel) and translation efficiencies (right side of the panel) of the constructs. All construct designations are indicated next to the schematic representations. Translation efficiencies of the CER reporter were normalized to the reference RFP construct (shown on top of the panel) and indicated as a diagram. Exact values are shown next to the corresponding bars. A scale was changed as indicated for the bottom two graphs for clarity of presentation. Actual sequences could be found in Supplementary Table S1.
Figure 4.
Figure 4.
Translation efficiency of second cistron (CER) in a set of bicistronic constructs. (A) Frequency distribution of intercistronic distances among the E. coli genes located on the same mRNA molecules. (B) Schematic representation (left side of the panel) and translation efficiencies (right side of the panel) of the constructs (similar to those on Figure 1B). All construct designations are indicated next to the schematic representations. Actual sequences could be found in Supplementary Tables S1 and S2. ‘SD’ indicates the presence of the Shine-Dalgarno sequence (gray bars). Construct names devoid of ‘SD’ indicate an absence of the Shine-Dalgarno sequence (white bars). ‘-RFP’ indicates premature termination of the first cistron precluding reinitiation (black bars).
Figure 5.
Figure 5.
Influence of the A/U-rich sequences upstream of the SD on efficiency of expression. (A) Schematic representation (left side of the panel) and translation efficiencies (right side of the panel) of the constructs (similar to those on Figure 1B). All constructs designations are indicated next to the schematic representations. ‘A/U’ indicates the presence of the A/U-rich sequence (black bars). Construct names devoid of ‘A/U’ indicate an absence of A/U-rich sequence (gray bars). (B) A more detailed examination of the stimulatory effect of A/U-rich enhancer dependence on the SD sequence, start codon identity, cistron location and previous cistron translation (if applicable). Schematic representation (left side of the panel) and translation efficiencies (right side of the panel) of the constructs (similar to those on Figure 1B). All construct designations are indicated next to the schematic representations. Actual sequences could be found in Supplementary Tables S1 and S2.
Figure 6.
Figure 6.
Comparison of translation efficiency and mRNA quantity for a set of model mRNAs. Shown are mRNA designations (left side) corresponding to those on Figure 1. The graph (right side) indicates expression efficiency in a logarithmic scale as determined by CER/RFP relative fluorescence (gray bars) and mRNA abundance in a logarithmic scale as determined by RT qPCP (black bars).

References

    1. Kudla G, Murray AW, Tollervey D, Plotkin JB. Coding-sequence determinants of gene expression in Escherichia coli. Science. 2009;324:255–258. - PMC - PubMed
    1. Shine J, Dalgarno L. The 3′-terminal sequence of Escherichia coli 16S ribosomal RNA: complementarity to nonsense triplets and ribosome binding sites. Proc. Natl Acad. Sci. USA. 1974;71:1342–1346. - PMC - PubMed
    1. Boni IV, Isaeva DM, Musychenko ML, Tzareva NV. Ribosome-messenger recognition: mRNA target sites for ribosomal protein S1. Nucleic Acids Res. 1991;19:155–162. - PMC - PubMed
    1. Dreyfus M. What constitutes the signal for the initiation of protein synthesis on Escherichia coli mRNAs? J. Mol. Biol. 1988;204:79–94. - PubMed
    1. Butler JS, Springer M, Dondon J, Graffe M, Grunberg-Manago M. Escherichia coli protein synthesis initiation factor IF3 controls its own gene expression at the translational level in vivo. J. Mol. Biol. 1986;192:767–780. - PubMed

Publication types