. 2012 Nov;122(11):4172-89.
doi: 10.1172/JCI63377. Epub 2012 Oct 24.

Osteoblasts mediate the adverse effects of glucocorticoids on fuel metabolism

Affiliations

Osteoblasts mediate the adverse effects of glucocorticoids on fuel metabolism

Tara C Brennan-Speranza et al. J Clin Invest. 2012 Nov.

Abstract

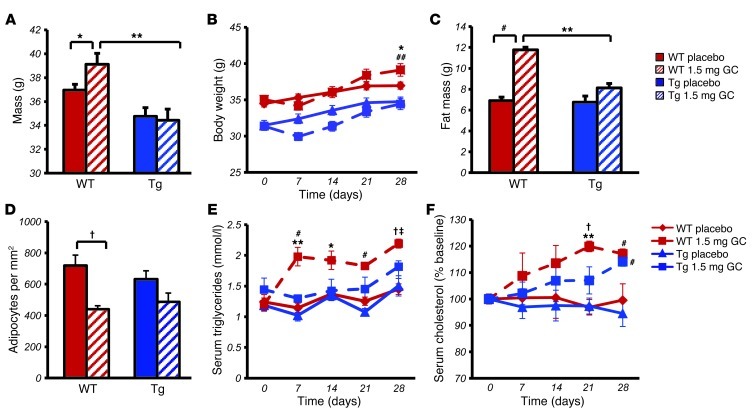
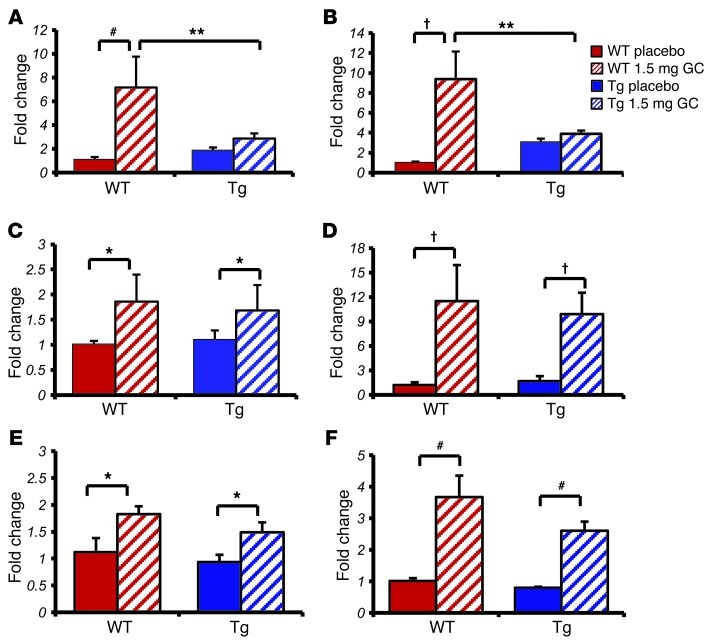
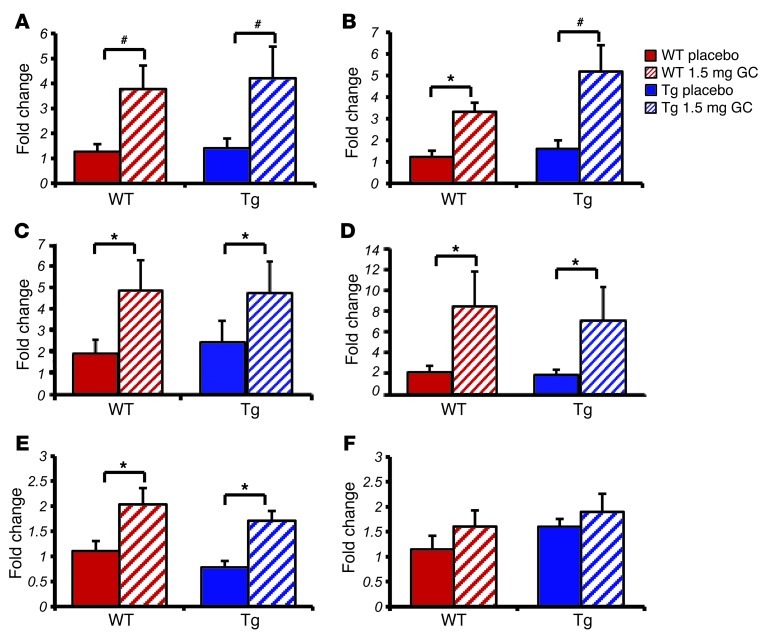
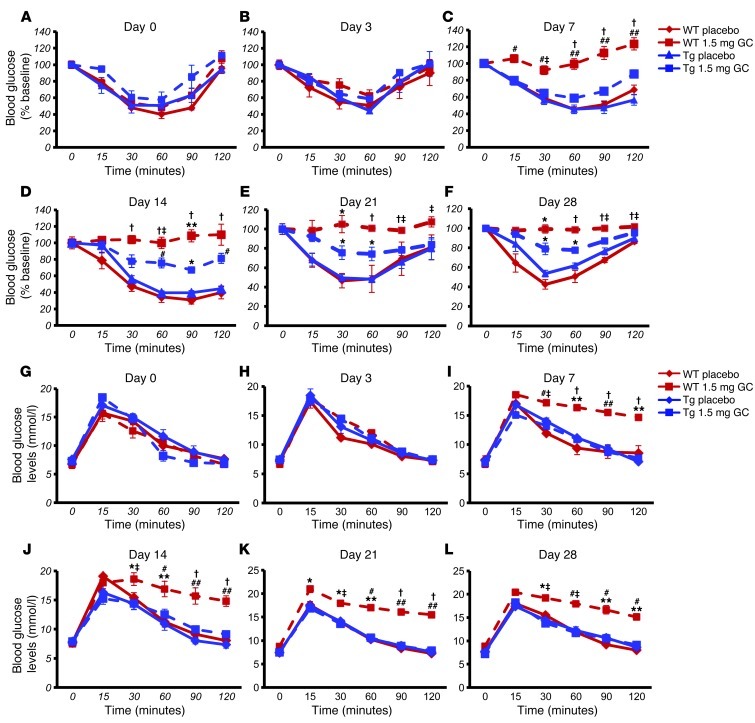
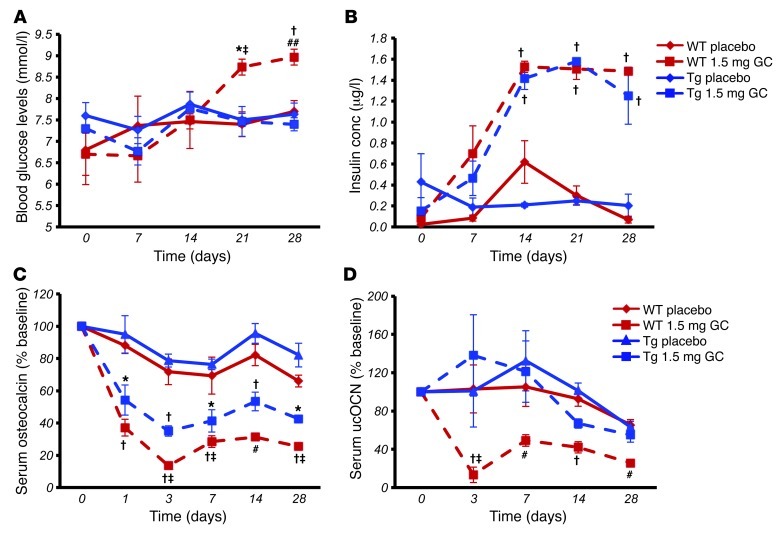
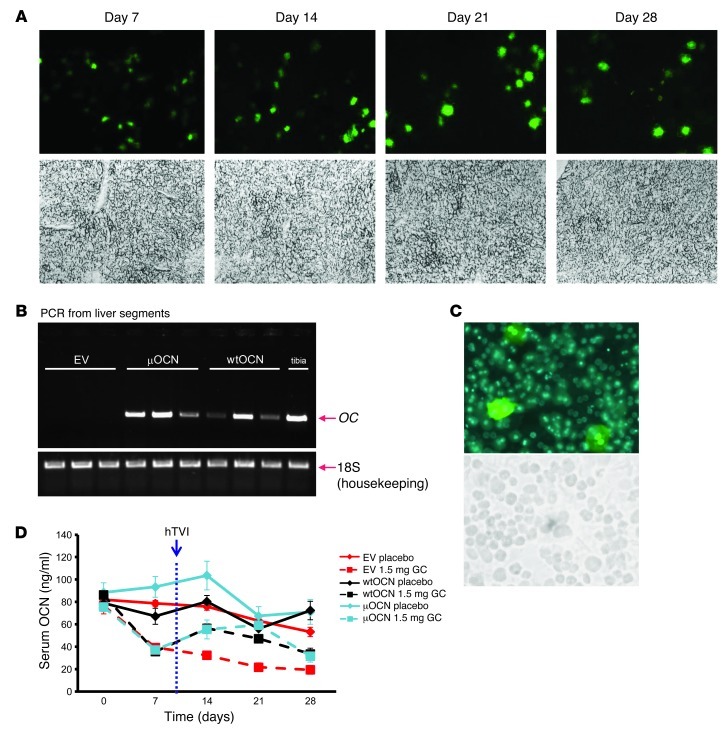
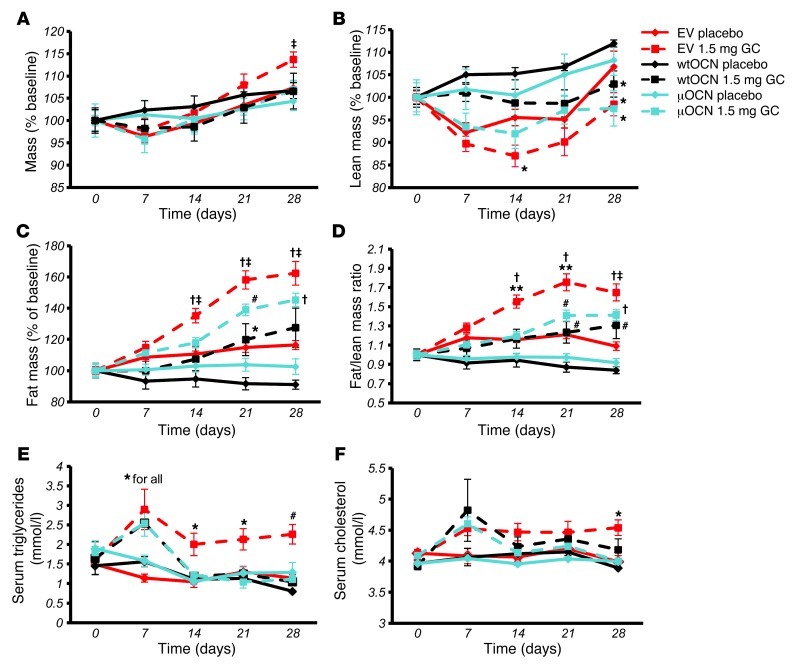
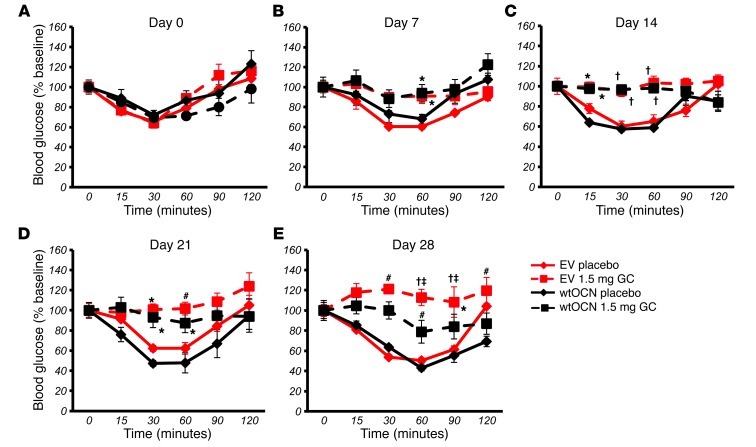
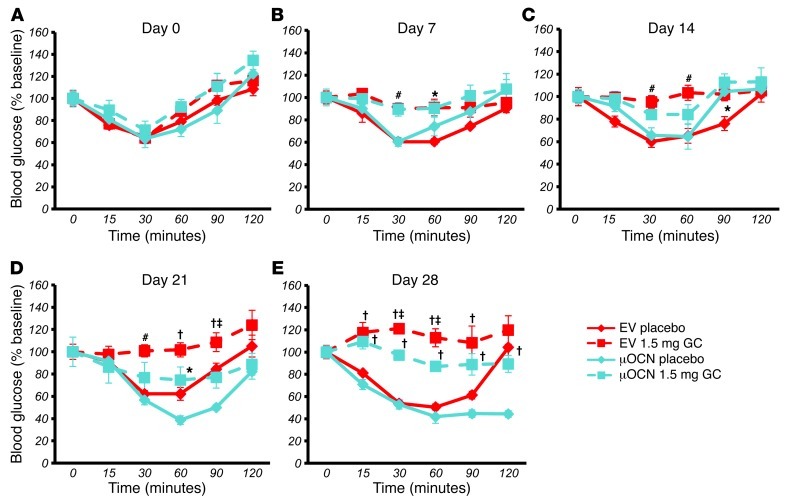
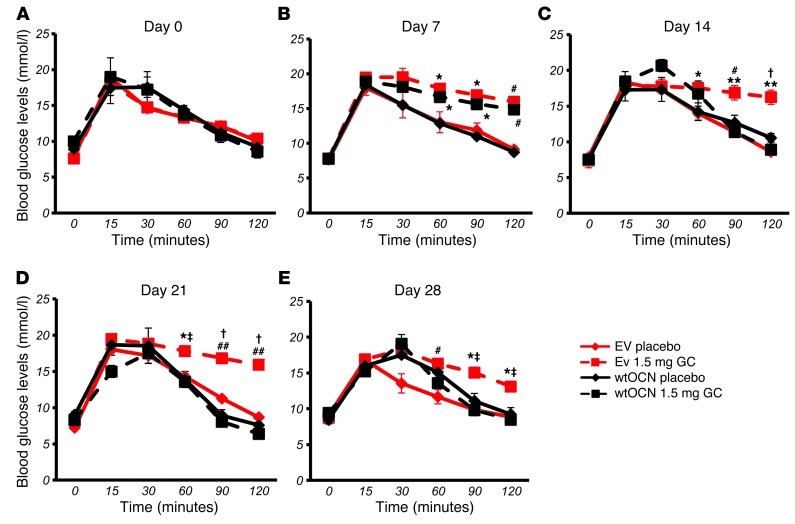
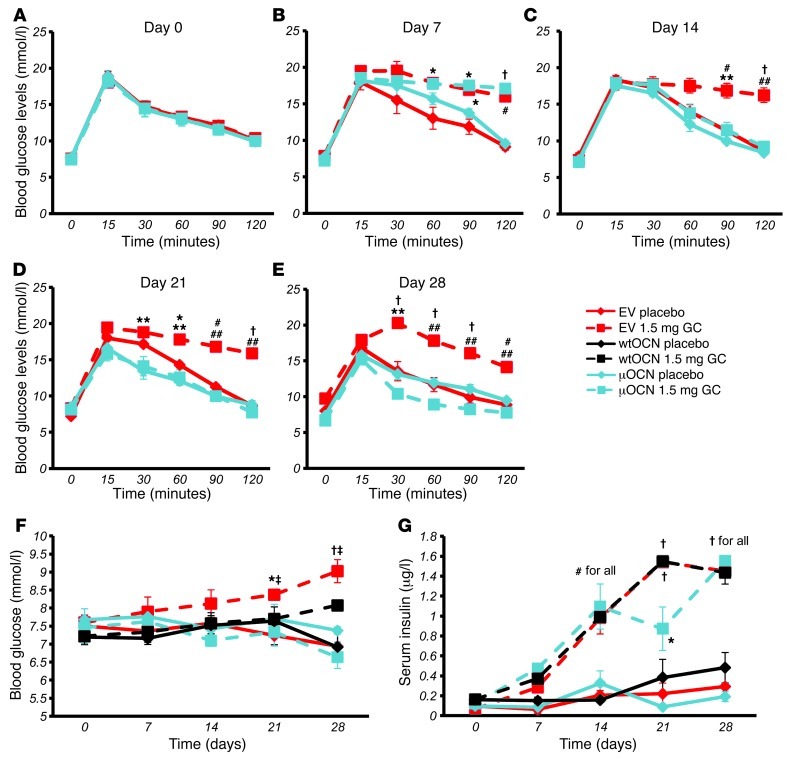
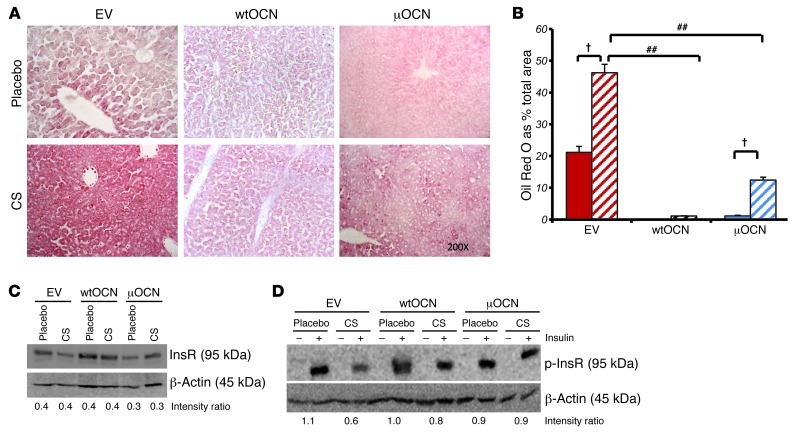
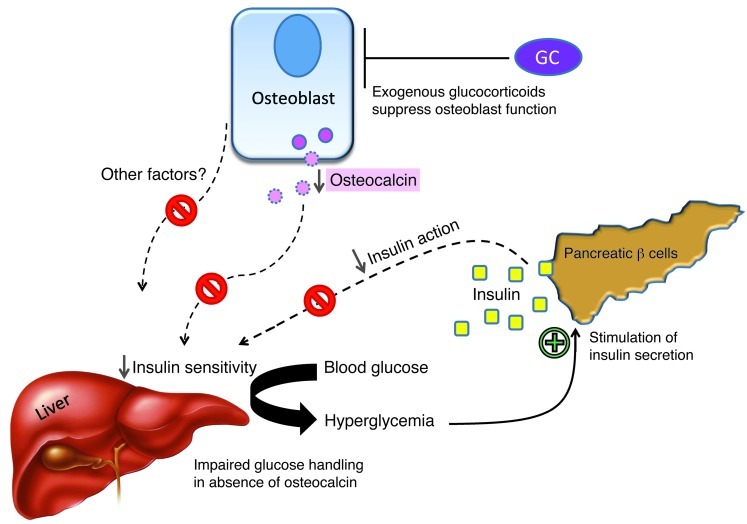
Long-term glucocorticoid treatment is associated with numerous adverse outcomes, including weight gain, insulin resistance, and diabetes; however, the pathogenesis of these side effects remains obscure. Glucocorticoids also suppress osteoblast function, including osteocalcin synthesis. Osteocalcin is an osteoblast-specific peptide that is reported to be involved in normal murine fuel metabolism. We now demonstrate that osteoblasts play a pivotal role in the pathogenesis of glucocorticoid-induced dysmetabolism. Osteoblast-targeted disruption of glucocorticoid signaling significantly attenuated the suppression of osteocalcin synthesis and prevented the development of insulin resistance, glucose intolerance, and abnormal weight gain in corticosterone-treated mice. Nearly identical effects were observed in glucocorticoid-treated animals following heterotopic (hepatic) expression of both carboxylated and uncarboxylated osteocalcin through gene therapy, which additionally led to a reduction in hepatic lipid deposition and improved phosphorylation of the insulin receptor. These data suggest that the effects of exogenous high-dose glucocorticoids on insulin target tissues and systemic energy metabolism are mediated, at least in part, through the skeleton.


Figures

Figure 1
Figure 1. Targeted disruption of glucocorticoid signaling in osteoblasts profoundly affects glucocorticoid-induced changes in body composition and blood lipids.
(A) End point (day 28) body weight of WT and Tg mice treated with 1.5 mg corticosterone (1.5 mg GC) per week or placebo. (B) Body weight of treated WT and Tg mice over the 4-week period. (C) Fat mass in WT and Tg mice at day 28 measured by dual-energy x-ray absorptiometry. (D) Adipose cells per mm2 in H&E-stained sections of gonadal fat pads following 28 days of treatment. (E) Serum triglyceride levels of treated WT and Tg mice over the 4-week period. (F) Serum cholesterol levels of treated WT and Tg mice over the 4-week period. *P < 0.05, #P < 0.01, P < 0.001 compared with respective genotype placebo-treated controls; P < 0.05, **P < 0.01, ##P < 0.001 WT 1.5 mg GC compared with Tg 1.5 mg GC (2-way ANOVA followed by post-hoc analysis; repeated-measures ANOVA followed by post-hoc analysis for time-dependent measurements; error bars represent SEM).
Figure 2
Figure 2. Targeted disruption of glucocorticoid signaling in osteoblasts affects acute glucocorticoid signaling in osteoblasts but not muscle or liver as shown by qRT-PCR.
(A and B) Quantitative RT-PCR analysis of tibia RNA expression in WT and Tg mice treated for 3 days with either placebo or corticosterone of genes known to be modulated by glucocorticoids: (A) Gilz and (B) Fkbp5. (C and D) Quantitative RT-PCR analysis of muscle RNA expression of (C) Gilz and (D) Fkbp5 in WT and Tg mice treated for 3 days with placebo or corticosterone. (E and F) Quantitative RT-PCR analysis of liver RNA expression of (E) Gilz and (F) Fkbp5 in WT and Tg mice treated for 3 days with placebo or corticosterone. *P < 0.05, #P < 0.01, P < 0.001 compared with respective genotype placebo-treated controls; **P < 0.01 WT 1.5 mg GC compared with Tg 1.5 mg GC (2-way ANOVA followed by post-hoc analysis; error bars represent SEM).
Figure 3
Figure 3. Targeted disruption of glucocorticoid signaling in osteoblasts does not affect acute glucocorticoid signaling in white adipose tissue as shown by qRT-PCR.
Quantitative RT-PCR analysis of white adipose tissue RNA expression in WT and Tg mice treated for 3 days with either placebo or corticosterone of genes known to be modulated by glucocorticoids: (A) Gilz, (B) Fkbp5, (C) Fabp4, (D) Hsd11b1, (E) Pparg, and (F) Cebpa. *P < 0.05, #P < 0.01 compared with respective genotype placebo-treated controls (2-way ANOVA followed by post-hoc analysis; error bars represent SEM).
Figure 4
Figure 4. Targeted disruption of glucocorticoid signaling in osteoblasts partially prevents impaired metabolic responses seen in glucocorticoid-treated WT mice.
(AF) ITTs in WT (red) and Tg (blue) mice treated with either placebo (solid lines) or 1.5 mg corticosterone per week (dashed lines). (GL) oGTTs on WT (red) and Tg (blue) mice treated with either placebo (solid lines) or 1.5 mg corticosterone per week (dashed lines). *P < 0.05, #P < 0.01, P < 0.001 compared with respective genotype placebo-treated controls; P < 0.05, **P < 0.01, ##P < 0.001 WT 1.5 mg GC compared with Tg 1.5 mg GC (repeated-measures ANOVA followed by post-hoc analysis for time-dependent measurements; error bars represent SEM).
Figure 5
Figure 5. Targeted disruption of glucocorticoid signaling in osteoblasts partially prevents impaired metabolic responses seen in glucocorticoid-treated WT mice but has no effect on total serum insulin concentrations.
(A) Baseline fasting blood glucose concentration levels in WT and Tg mice treated with 1.5 mg corticosterone per week or placebo over the 4-week period (day 0, before treatment; day 28, after 4 weeks of treatment). (B) Baseline fasting serum insulin levels in WT and Tg mice treated with 1.5 mg corticosterone per week or placebo over the 4-week period. conc, concentration. (C) Serum total osteocalcin concentrations in WT and Tg mice treated with 1.5 mg corticosterone per week or placebo over the 4-week period (composite of 2 experiments standardized by expression as percentage of baseline). (D) Serum uncarboxylated osteocalcin (unOCN) concentrations in WT and Tg mice treated with 1.5 mg corticosterone per week or placebo over the 4-week period (composite of 2 experiments standardized by expression as percentage of baseline). *P < 0.05, #P < 0.01, P < 0.001 compared with respective genotype placebo-treated controls; P < 0.05, ##P < 0.001 WT 1.5 mg GC compared with Tg 1.5 mg GC (repeated-measures ANOVA followed by post-hoc analysis for time-dependent measurements; error bars represent SEM).
Figure 6
Figure 6. Validating heterotopic expression following gene therapy using hTVI.
(A) Fluorescent GFP expression in frozen liver sections 7, 14, 21, and 28 days after hTVI of the pLIVE vector containing GFP. Halogen light microscope images of same fields of view appear in the bottom row. Original magnification, ×100. (B) RT-PCR of RNA extracted from liver segments of mice 28 days after hTVI of vectors containing either no cDNA insert (EV) or the wtOCN or the μOCN insert to determine RNA expression of osteocalcin (OC). 18S was amplified as the housekeeping gene for loading reference. RNA was also extracted from mouse tibias as a positive control for OC expression. (C) Fluorescent image of GFP expression in primary hepatocytes isolated from mice 28 days after hTVI of pLIVE vector plus GFP cDNA. A halogen light microscope image of the same field of view appears in the bottom row. Original magnification, ×200. (D) Serum osteocalcin concentrations (measured by IRMA) of EV, wtOCN, and μOCN vector–receiving mice treated with 1.5 mg corticosterone per week or placebo (plc) over the 4-week period.
Figure 7
Figure 7. Heterotopic expression of osteocalcin from day 8 reduces glucocorticoid-induced changes in body composition.
(A) Body weight as percentage of baseline of EV, wtOCN, and μOCN vector–receiving mice (vector administered via hTVI on day 8) treated with 1.5 mg corticosterone per week or placebo over the 4-week period. (B) Lean body mass of vector-receiving mice treated over the 4-week period. (C) Body fat mass of vector-receiving mice treated over the 4-week period. (D) Fat/lean mass ratio of vector-receiving mice treated over the 4-week period. (E) Serum triglyceride levels of vector-receiving mice treated over the 4-week period. (F) Serum cholesterol levels of vector-receiving mice treated over the 4-week period (“for all” indicates that significance applies to all groups at this time point). *P < 0.05, #P < 0.01, P < 0.001 compared with respective vector-receiving placebo-treated controls; P < 0.05, **P < 0.01 compared with other corticosterone-treated groups receiving wtOCN and μOCN vectors (repeated-measures ANOVA followed by post-hoc analysis; error bars represent SEM).
Figure 8
Figure 8. Heterotopic expression of wtOCN improves glucocorticoid-induced insulin resistance.
ITTs in EV- (red) and wtOCN (black) vector–receiving mice (vector administered via hTVI on day 8) treated with either placebo (solid lines) or 1.5 mg corticosterone per week (dashed lines) on (A) day 0, (B) day 7, (C) day 14, (D) day 21, and (E) day 28. *P < 0.05, #P < 0.01, P < 0.001 compared with respective vector-receiving placebo-treated controls; P < 0.05 compared with other corticosterone-treated groups receiving μOCN or wtOCN vectors (repeated-measures ANOVA followed by post-hoc analysis for time-dependent measurements; error bars represent SEM).
Figure 9
Figure 9. Heterotopic expression of μOCN improves glucocorticoid-induced insulin resistance.
ITTs in EV- (red) and μOCN (blue) vector–receiving mice (vector administered via hTVI on day 8) treated with either placebo (solid lines) or 1.5 mg corticosterone per week (dashed lines) on (A) day 0, (B) day 7, (C) day 14, (D) day 21, and (E) day 28. *P < 0.05, #P < 0.01, P < 0.001 compared with respective vector-receiving placebo-treated controls; P < 0.05 compared with other CS, corticosterone-treated groups receiving μOCN or wtOCN vectors (repeated-measures ANOVA followed by post-hoc analysis for time-dependent measurements; error bars represent SEM).
Figure 10
Figure 10. Heterotopic expression of wtOCN improves glucocorticoid-induced glucose tolerance.
oGTTs in EV- (red) and wtOCN (black) vector–receiving mice (vector administered via hTVI on day 8) treated with either placebo (solid lines) or 1.5 mg corticosterone per week (dashed lines) on (A) day 0, (B) day 7, (C) day 14, (D) day 21, and (E) day 28. *P < 0.05, #P < 0.01, P < 0.001 compared with respective vector-receiving placebo-treated controls; P < 0.05, **P < 0.01, ##P < 0.001 compared with other CS, corticosterone-treated groups receiving μOCN or wtOCN vectors (repeated-measures ANOVA followed by post-hoc analysis for time-dependent measurements; error bars represent SEM).
Figure 11
Figure 11. Heterotopic expression of μOCN from day 8 improves glucocorticoid-induced glucose tolerance.
(AE) oGTTs in EV- (red) and μOCN (blue) vector–receiving mice (vector administered via hTVI on day 8) treated with either placebo (solid lines) or 1.5 mg corticosterone per week (dashed lines) on (A) day 0, (B) day 7, (C) day 14, (D) day 21, and (E) day 28. (F) Baseline fasting blood glucose concentration levels in EV- and wtOCN and μOCN vector–receiving mice treated with 1.5 mg corticosterone per week or placebo over the 4-week period. (G) Fasting serum insulin levels in EV- and wtOCN and μOCN vector–receiving mice treated with 1.5 mg corticosterone per week or placebo over the 4-week period (“for all” indicates that significance applies to all groups at this time point). *P < 0.05, #P < 0.01, P < 0.001 compared with respective vector-receiving placebo-treated controls; P < 0.05, **P < 0.01, ##P < 0.001 compared with other CS, corticosterone-treated groups receiving μOCN or wtOCN vectors (repeated-measures ANOVA followed by post-hoc analysis for time-dependent measurements; error bars represent SEM).
Figure 12
Figure 12. Heterotopic expression of osteocalcin reduces lipid deposition in the liver and rescues insulin signaling.
(A) Oil Red O staining on frozen liver sections of EV- and wtOCN and μOCN vector–receiving mice treated with 1.5 mg corticosterone per week or placebo. Original magnification, ×200. CS, corticosterone. (B) Quantification of Oil Red O in frozen liver sections. Bars represent the percentage of lipid-stained area over total measured area. (C) Western blot of total InsR of cell lysate collected from isolated primary hepatocytes of EV- and wtOCN and μOCN vector–receiving mice. Cells were treated for 24 hours with either corticosterone (100 mM) or placebo. Density ratios were calculated using Quantity One software. (D) Western blot of phosphorylated InsR (p-InsR) of cell lysate collected from isolated primary hepatocytes of EV- and wtOCN and μOCN vector–receiving mice. Cells were treated for 24 hours with either corticosterone (100 mM) or placebo and stimulated with insulin (50 nM) or placebo 5 minutes before lysis. P < 0.001 compared with respective vector-receiving placebo-treated controls, ##P < 0.001 compared with other corticosterone-treated groups receiving μOCN vectors (2-way ANOVA followed by post-hoc analysis; error bars represent SEM).
Figure 13
Figure 13. Schematic model of the effects exogenous high-dose glucocorticoids on insulin sensitivity and glucose handling in mice.
Under physiological conditions, osteocalcin improves insulin sensitivity in peripheral tissues such as the liver, allowing for efficient glucose handling in times of high insulin release. This action is impaired when glucocorticoids (GCs) interfere with osteoblast activity, suppressing the production and secretion of osteocalcin (and possibly other factors). The lack of osteocalcin leads to decreased insulin sensitivity, which results in impaired hepatic glucose output inhibition, peripheral glucose uptake, hyperglycemia, and a compensatory increase in insulin release, all of which are characteristic features of glucocorticoid-induced (pre-) diabetes. In the absence of osteocalcin, high insulin levels have reduced effects on end-organ glucose uptake.

Comment in

References

    1. Barnes PJ. How corticosteroids control inflammation: Quintiles Prize Lecture 2005. Br J Pharmacol. 2006;148(3):245–254. doi: 10.1038/sj.bjp.0706736. - DOI - PMC - PubMed
    1. Buttgereit F, et al. Efficacy of modified-release versus standard prednisone to reduce duration of morning stiffness of the joints in rheumatoid arthritis (CAPRA-1): a double-blind, randomised controlled trial. Lancet. 2008;371(9608):205–214. doi: 10.1016/S0140-6736(08)60132-4. - DOI - PubMed
    1. Kassi E, Moutsatsou P. Glucocorticoid receptor signaling and prostate cancer. Cancer Lett. 2011;302(1):1–10. doi: 10.1016/j.canlet.2010.10.020. - DOI - PubMed
    1. Sambrook P, et al. Corticosteroid effects on proximal femur bone loss. J Bone Miner Res. 1990;5(12):1211–1216. doi: 10.1002/jbmr.5650051204. - DOI - PubMed
    1. Schakman O, Gilson H, Thissen JP. Mechanisms of glucocorticoid-induced myopathy. J Endocrinol. 2008;197(1):1–10. doi: 10.1677/JOE-07-0606. - DOI - PubMed

Publication types

MeSH terms