

Simulating radiotherapy effect in high-grade glioma by using diffusive modeling and brain atlases
- PMID: 23093856
- PMCID: PMC3471023
- DOI: 10.1155/2012/715812
Simulating radiotherapy effect in high-grade glioma by using diffusive modeling and brain atlases
Erratum in
-
Corrigendum to "Simulating Radiotherapy Effect in High-Grade Glioma by Using Diffusive Modeling and Brain Atlases".Biomed Res Int. 2018 Feb 28;2018:2712657. doi: 10.1155/2018/2712657. eCollection 2018. Biomed Res Int. 2018. PMID: 29682527 Free PMC article.
Abstract
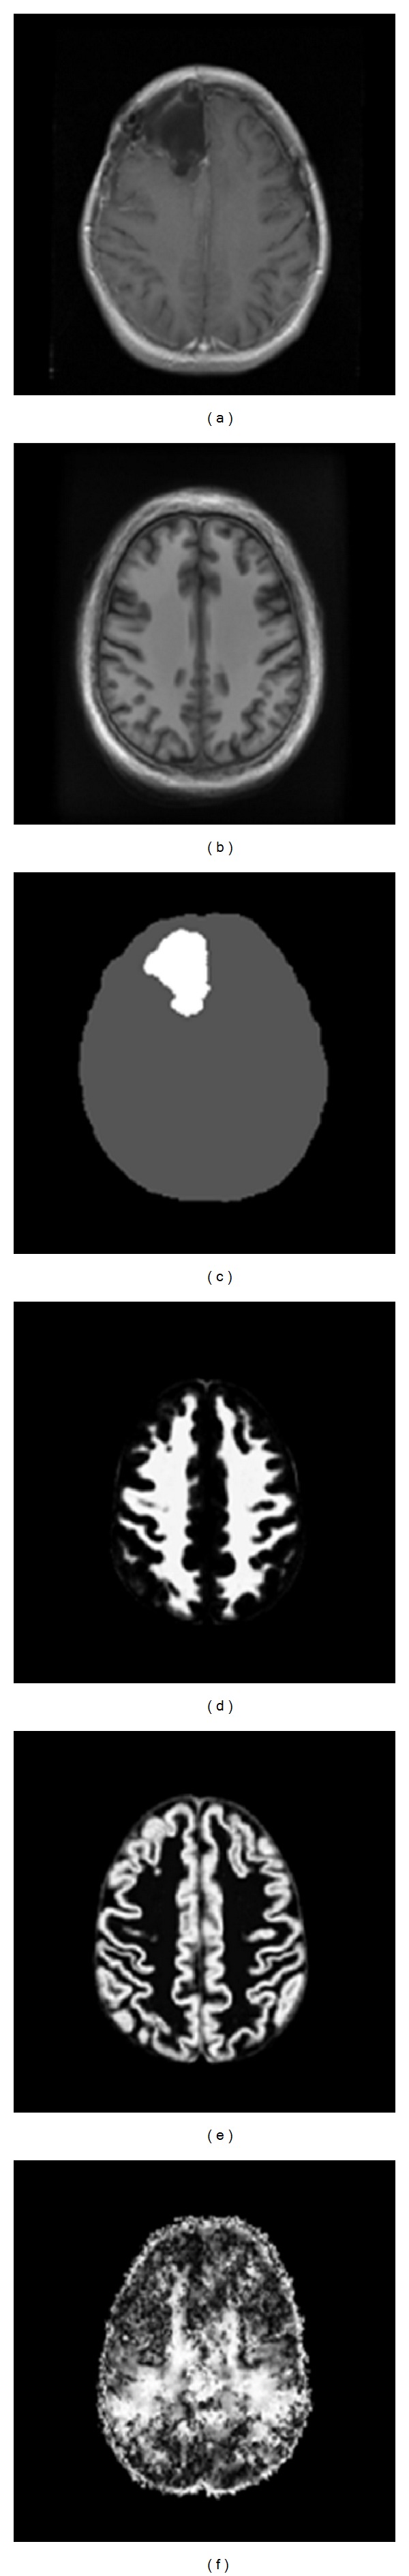
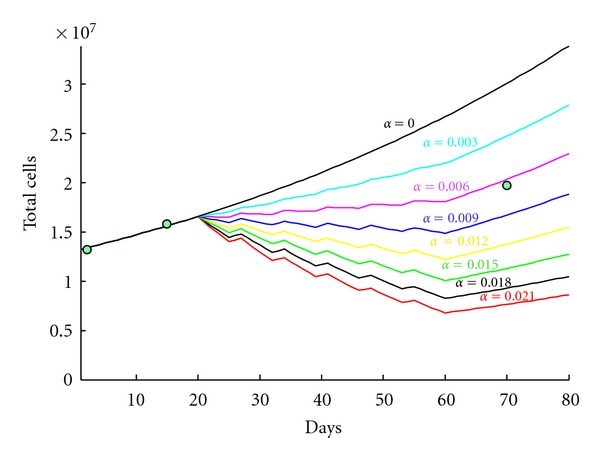
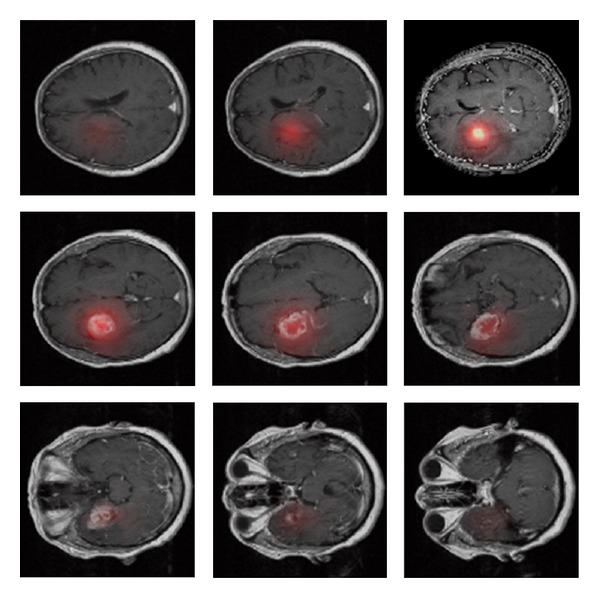
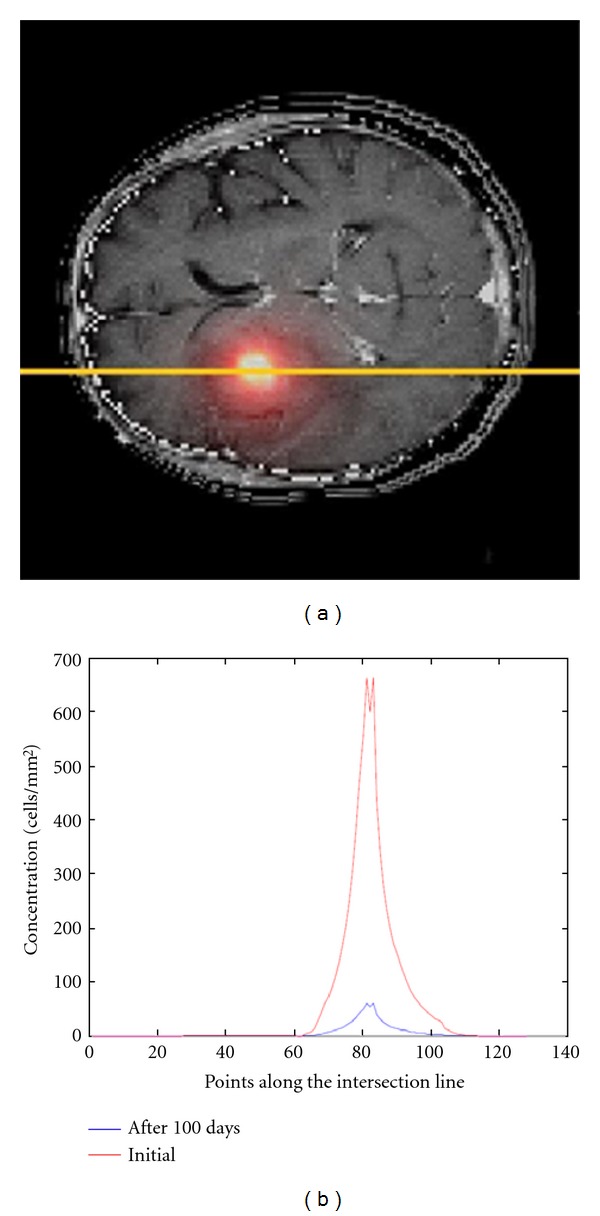
Applying diffusive models for simulating the spatiotemporal change of concentration of tumour cells is a modern application of predictive oncology. Diffusive models are used for modelling glioblastoma, the most aggressive type of glioma. This paper presents the results of applying a linear quadratic model for simulating the effects of radiotherapy on an advanced diffusive glioma model. This diffusive model takes into consideration the heterogeneous velocity of glioma in gray and white matter and the anisotropic migration of tumor cells, which is facilitated along white fibers. This work uses normal brain atlases for extracting the proportions of white and gray matter and the diffusion tensors used for anisotropy. The paper also presents the results of applying this glioma model on real clinical datasets.
Figures
Comment in
-
Comment on "Simulating Radiotherapy Effect in High-Grade Glioma by Using Diffusive Modeling and Brain Atlases".Biomed Res Int. 2015;2015:801057. doi: 10.1155/2015/801057. Epub 2015 Nov 22. Biomed Res Int. 2015. PMID: 26759812 Free PMC article. No abstract available.
Similar articles
-
Comment on "Simulating Radiotherapy Effect in High-Grade Glioma by Using Diffusive Modeling and Brain Atlases".Biomed Res Int. 2015;2015:801057. doi: 10.1155/2015/801057. Epub 2015 Nov 22. Biomed Res Int. 2015. PMID: 26759812 Free PMC article. No abstract available.
-
High-grade glioma diffusive modeling using statistical tissue information and diffusion tensors extracted from atlases.IEEE Trans Inf Technol Biomed. 2012 Mar;16(2):255-63. doi: 10.1109/TITB.2011.2171190. Epub 2011 Oct 10. IEEE Trans Inf Technol Biomed. 2012. PMID: 21990337
-
Cognitive and radiological effects of radiotherapy in patients with low-grade glioma: long-term follow-up.Lancet Neurol. 2009 Sep;8(9):810-8. doi: 10.1016/S1474-4422(09)70204-2. Epub 2009 Aug 7. Lancet Neurol. 2009. PMID: 19665931
-
[Conformal radiotherapy of brain tumors].Cancer Radiother. 1999 Sep-Oct;3(5):407-13. doi: 10.1016/s1278-3218(00)87978-0. Cancer Radiother. 1999. PMID: 10572510 Review. French.
-
Radiotherapy of high-grade gliomas: current standards and new concepts, innovations in imaging and radiotherapy, and new therapeutic approaches.Chin J Cancer. 2014 Jan;33(1):16-24. doi: 10.5732/cjc.013.10217. Chin J Cancer. 2014. PMID: 24384237 Free PMC article. Review.
Cited by
-
Clinical implications of in silico mathematical modeling for glioblastoma: a critical review.J Neurooncol. 2018 Jan;136(1):1-11. doi: 10.1007/s11060-017-2650-2. Epub 2017 Oct 28. J Neurooncol. 2018. PMID: 29081039 Review.
-
Inducing Biomechanical Heterogeneity in Brain Tumor Modeling by MR Elastography: Effects on Tumor Growth, Vascular Density and Delivery of Therapeutics.Cancers (Basel). 2022 Feb 10;14(4):884. doi: 10.3390/cancers14040884. Cancers (Basel). 2022. PMID: 35205632 Free PMC article.
-
A Proposed Paradigm Shift in Initializing Cancer Predictive Models with DCE-MRI Based PK Parameters: A Feasibility Study.Cancer Inform. 2015 Jun 10;14(Suppl 4):7-18. doi: 10.4137/CIN.S19339. eCollection 2015. Cancer Inform. 2015. PMID: 26085787 Free PMC article.
-
Comment on "Simulating Radiotherapy Effect in High-Grade Glioma by Using Diffusive Modeling and Brain Atlases".Biomed Res Int. 2015;2015:801057. doi: 10.1155/2015/801057. Epub 2015 Nov 22. Biomed Res Int. 2015. PMID: 26759812 Free PMC article. No abstract available.
-
Corrigendum to "Simulating Radiotherapy Effect in High-Grade Glioma by Using Diffusive Modeling and Brain Atlases".Biomed Res Int. 2018 Feb 28;2018:2712657. doi: 10.1155/2018/2712657. eCollection 2018. Biomed Res Int. 2018. PMID: 29682527 Free PMC article.
References
-
- WHO. World Health Organization, 2010, http://www.who.int/mediacentre/factsheets/fs297.
-
- Boyle P, Levin B. World cancer report 2008. IARC, 2010.
-
- Brain Tumors. American Brain Tumor Association, http://www.abta.org/
-
- Central Brain Tumor Registry of the United States. Chicago, Ill, USA: 2000. Statistical report: primary brain tumors in the United States, 1992–1997.
-
- Tovi M. MR imaging in cerebral gliomas analysis of tumour tissue components. Acta Radiologica, Supplement. 1993;384:1–24. - PubMed
Publication types
MeSH terms
LinkOut - more resources
Full Text Sources
Medical