. 2012;8(10):e1002708.
doi: 10.1371/journal.pcbi.1002708. Epub 2012 Oct 18.

CAVER 3.0: a tool for the analysis of transport pathways in dynamic protein structures

Affiliations

CAVER 3.0: a tool for the analysis of transport pathways in dynamic protein structures

Eva Chovancova et al. PLoS Comput Biol. 2012.

Abstract

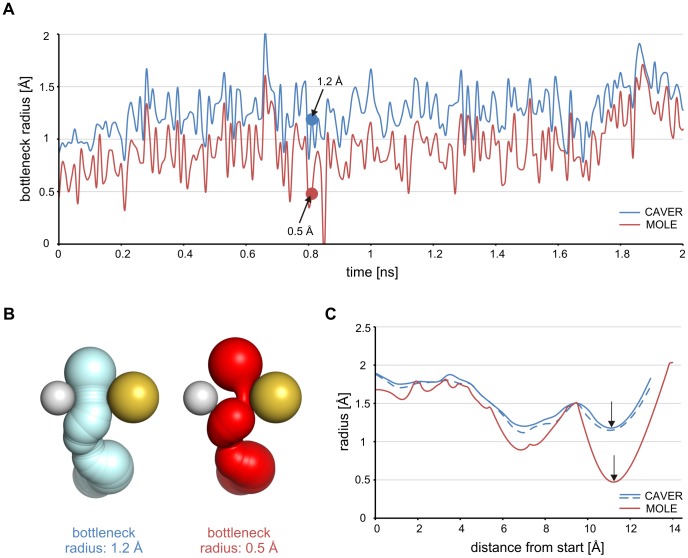
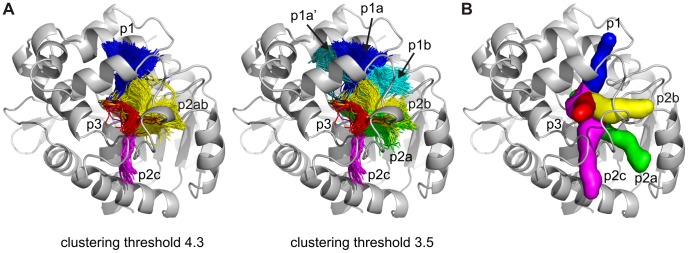
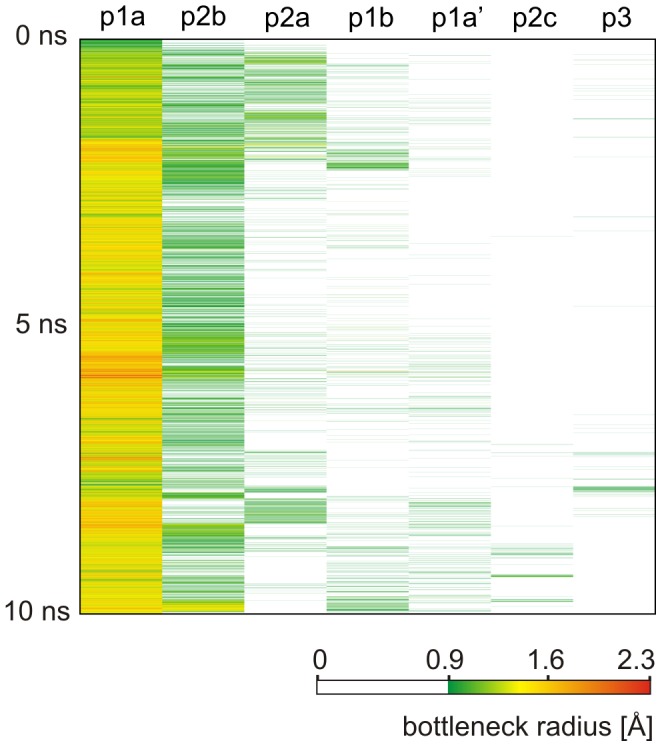
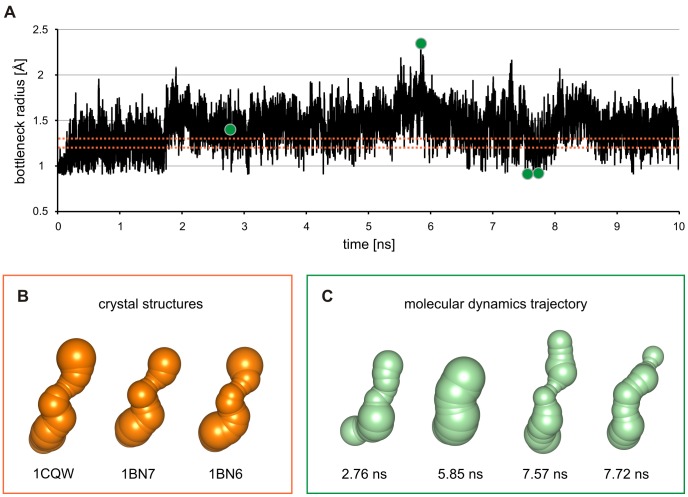
Tunnels and channels facilitate the transport of small molecules, ions and water solvent in a large variety of proteins. Characteristics of individual transport pathways, including their geometry, physico-chemical properties and dynamics are instrumental for understanding of structure-function relationships of these proteins, for the design of new inhibitors and construction of improved biocatalysts. CAVER is a software tool widely used for the identification and characterization of transport pathways in static macromolecular structures. Herein we present a new version of CAVER enabling automatic analysis of tunnels and channels in large ensembles of protein conformations. CAVER 3.0 implements new algorithms for the calculation and clustering of pathways. A trajectory from a molecular dynamics simulation serves as the typical input, while detailed characteristics and summary statistics of the time evolution of individual pathways are provided in the outputs. To illustrate the capabilities of CAVER 3.0, the tool was applied for the analysis of molecular dynamics simulation of the microbial enzyme haloalkane dehalogenase DhaA. CAVER 3.0 safely identified and reliably estimated the importance of all previously published DhaA tunnels, including the tunnels closed in DhaA crystal structures. Obtained results clearly demonstrate that analysis of molecular dynamics simulation is essential for the estimation of pathway characteristics and elucidation of the structural basis of the tunnel gating. CAVER 3.0 paves the way for the study of important biochemical phenomena in the area of molecular transport, molecular recognition and enzymatic catalysis. The software is freely available as a multiplatform command-line application at http://www.caver.cz.


Conflict of interest statement

The authors have declared that no competing interests exist.

Figures

Figure 1
Figure 1. Comparison of the p1 tunnel of DhaA calculated by CAVER 3.0 and MOLE 1.2.
(A) Time evolution of the bottleneck radius calculated by CAVER 3.0 (blue) and MOLE 1.2 (red). Only a part of the 10 ns MD simulation is shown for clarity. The sample snapshot (black arrows) was taken at 0.81 ns. (B) Geometry of the p1 tunnel in the sample snapshot calculated by CAVER 3.0 (blue) and MOLE 1.2 (red). Hydrogen atom of the bottleneck residue Ala145 (white ball) is shown together with the sulfur atom of the bottleneck residue Cys176 (yellow ball) and with sphere representation of the tunnels. The underestimation of the bottleneck radius by MOLE 1.2 is visible as an empty space between the tunnel and the hydrogen atom of Ala145. (C) Profile of the p1 tunnel in the sample snapshot calculated by CAVER 3.0 (blue) and MOLE 1.2 (red). The dashed line indicates the profile representing the maximum possible difference between the CAVER-calculated (solid line) and the correct profile of the p1 tunnel.
Figure 2
Figure 2. Comparison of the DhaA tunnels identified by CAVER 3.0 with the previously proposed pathways.
(A) The top ranked collective pathways identified throughout the molecular dynamics simulation of DhaA by CAVER 3.0 are all depicted in one frame as pathway centerlines. The p2a and p2b tunnels were initially identified as one collective pathway—p2ab—using the clustering threshold of 4.3. Decreasing the clustering threshold to 3.5 led to the separation of the p2a and p2b tunnels as well as the splitting of the p1 collective pathway into three clusters—p1a, p1a′ and p1b. A random subsample of identified tunnels is shown for clarity. (B) Representative DhaA pathways (surface representation) for the release of products and/or exchange of water solvent as identified previously by RAMD and classical MD simulations .
Figure 3
Figure 3. Time evolution of the bottleneck radii of DhaA tunnels identified by CAVER 3.0.
The color map ranges from very narrow (green) to wide (red) bottlenecks. White color indicates that no pathway with bottleneck radius ≥0.9 Å was identified for the given pathway cluster in the given snapshot.
Figure 4
Figure 4. Time evolution of the DhaA p1 tunnel.
(A) Evolution of the p1 tunnel bottleneck radius over time. The dotted orange lines indicate bottleneck radii of the p1 tunnel in DhaA crystal structures with added hydrogen atoms: PDB-IDs 1BN6 and 1BN7 (bottleneck radius 1.2 Å) and 1CQW (1.3 Å). The four green circles indicate bottleneck radii of the p1 tunnel from the 2.76 ns (bottleneck radius 1.4 Å), 5.85 ns (2.3 Å), 7.57 ns (0.9 Å) and the 7.72 ns (0.9 Å) snapshots from the molecular dynamics simulation of DhaA. (B) The p1 tunnel identified in DhaA crystal structures with added hydrogen atoms (PDB-IDs 1CQW, 1BN6, 1BN7). (C) The p1 tunnel identified in the 2.76 ns, 5.85 ns, 7.57 ns and 7.72 ns snapshots of the MD trajectory of DhaA.
Figure 5
Figure 5. Bottleneck dynamics and structural basis of gating in the p1 tunnel of DhaA.
(A) The bottleneck 1 represents the most frequent bottleneck of the p1 tunnel and is mostly formed by Ala145, Phe149, Ala172 and Cys176. Comparison of snapshots with an open (red) and closed (blue) p1 tunnels suggested that the gating is mediated by: (i) movement of the N-terminal part of the cap domain carrying Ala145 and Phe149; (ii) movement of the α5-helix with Cys176 and Ala172; and (iii) conformational change of the bottleneck residues Phe149 and Cys176. The bottleneck radius in the selected snapshots with an open and closed tunnel was 2.3 Å and 0.9 Å, respectively. (B) The bottleneck 2 of the p1 tunnel is mostly formed by Thr148, Ala172 and Lys175. Comparison of snapshots with an open (red) and closed (green) p1 tunnel suggested that gating is mediated by: (i) movement of the N-terminal part of the cap domain carrying Thr148; (ii) movement of the α5-helix carrying Ala172; and (iii) the conformational change of the bottleneck residues Thr148 and Lys175. The bottleneck radius in the selected snapshot with an open and closed tunnel was 2.3 Å and 0.9 Å, respectively.

References

    1. Damborsky J, Petrek M, Banas P, Otyepka M (2007) Identification of tunnels in proteins, nucleic acids, inorganic materials and molecular ensembles. Biotechnol J 2: 62–67. - PubMed
    1. Agre P, Brown D, Nielsen S (1995) Aquaporin water channels: unanswered questions and unresolved controversies. Curr Opin Cell Biol 7: 472–483. - PMC - PubMed
    1. Gold VAM, Duong F, Collinson I (2007) Structure and function of the bacterial Sec translocon. Mol Membr Biol 24: 387–394. - PubMed
    1. Gouaux E, Mackinnon R (2005) Principles of selective ion transport in channels and pumps. Science 310: 1461–1465. - PubMed
    1. Jiang Y, Lee A, Chen J, Cadene M, Chait BT, et al. (2002) Crystal structure and mechanism of a calcium-gated potassium channel. Nature 417: 515–522. - PubMed

Publication types