Estimating the hidden burden of bovine tuberculosis in Great Britain
- PMID: 23093923
- PMCID: PMC3475695
- DOI: 10.1371/journal.pcbi.1002730
Estimating the hidden burden of bovine tuberculosis in Great Britain
Abstract
The number of cattle herds placed under movement restrictions in Great Britain (GB) due to the suspected presence of bovine tuberculosis (bTB) has progressively increased over the past 25 years despite an intensive and costly test-and-slaughter control program. Around 38% of herds that clear movement restrictions experience a recurrent incident (breakdown) within 24 months, suggesting that infection may be persisting within herds. Reactivity to tuberculin, the basis of diagnostic testing, is dependent on the time from infection. Thus, testing efficiency varies between outbreaks, depending on weight of transmission and cannot be directly estimated. In this paper, we use Approximate Bayesian Computation (ABC) to parameterize two within-herd transmission models within a rigorous inferential framework. Previous within-herd models of bTB have relied on ad-hoc methods of parameterization and used a single model structure (SORI) where animals are assumed to become detectable by testing before they become infectious. We study such a conventional within-herd model of bTB and an alternative model, motivated by recent animal challenge studies, where there is no period of epidemiological latency before animals become infectious (SOR). Under both models we estimate that cattle-to-cattle transmission rates are non-linearly density dependent. The basic reproductive ratio for our conventional within-herd model, estimated for scenarios with no statutory controls, increases from 1.5 (0.26-4.9; 95% CI) in a herd of 30 cattle up to 4.9 (0.99-14.0) in a herd of 400. Under this model we estimate that 50% (33-67) of recurrent breakdowns in Britain can be attributed to infection missed by tuberculin testing. However this figure falls to 24% (11-42) of recurrent breakdowns under our alternative model. Under both models the estimated extrinsic force of infection increases with the burden of missed infection. Hence, improved herd-level testing is unlikely to reduce recurrence unless this extrinsic infectious pressure is simultaneously addressed.
Conflict of interest statement
The authors have declared that no competing interests exist.
Figures


 where
where  measures the strength of density dependence,
  is the estimated transmission parameter and
  the per capita rate of turnover of the herd sampled from an empirical distribution and
  . Both models estimate that transmission is non-linearly density dependent with point estimates for the invasion threshold (R0 = 1) of 71 (8–674,95% CI) for the SORI model and 12 (1–833, 95% CI) for the SOR model. (B) The effective sensitivity of the SICCT test within our study population of herds measured under the standard (solid line) and severe (dashed line) interpretations and relative to the gold standard of confirmation with visible lesions (dotted line). (C,D) The infectious burden remaining after movement restrictions are lifted can be characterized in terms of the number of herds with at least one infectious animal remaining when movement restrictions are lifted (C) and the expected distribution of animals on those herds (D). Predictive distributions for (B,C,D) are calculated by simulating from the empirical distribution of herds taken from our study population, representing the national distribution of herds.
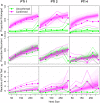
 ). Plotted values correspond to the average % difference in the probability of recurrence relative to the fitted SORI (Panel A) and SOR models (Panel B). Separate series are plotted for herds in PTI 1 (lime green circles), 2 (magenta squares) & 4 (sky blue diamonds). Predictive distributions illustrating the variability in these point (mean) estimates are presented in supplementary figure S13
.
). Plotted values correspond to the average % difference in the probability of recurrence relative to the fitted SORI (Panel A) and SOR models (Panel B). Separate series are plotted for herds in PTI 1 (lime green circles), 2 (magenta squares) & 4 (sky blue diamonds). Predictive distributions illustrating the variability in these point (mean) estimates are presented in supplementary figure S13
.References
-
- Gilbert M, Mitchell A, Bourn D, Mawdsley J, Clifton-Hadley R, et al. (2005) Cattle movements and bovine tuberculosis in Great Britain. Nature 435: 491–496. - PubMed
-
- Defra (2011) Bovine TB Eradication Programme for England. London: Department of Environment, Food and Rural Affairs. Unique identifier PB 13601. Available from: http://www.defra.gov.uk/publications/files/pb13601-bovinetb-eradication-... [Accessed 12 September 2012].
-
- Donnelly CA, Woodroffe R, Cox DR, Bourne FJ, Cheeseman CL, et al. (2003) Positive and negative effects of widespread badger culling on tuberculosis in cattle. Nature 439: 843–846. - PubMed
-
- Carrique-Mas JJ, Medley GF, Green LE (2008) Risks for bovine tuberculosis in British cattle farms restocked after the foot and mouth disease epidemic of 2001. Prev Vet Med 84: 85–93. - PubMed
Publication types
MeSH terms
LinkOut - more resources
Full Text Sources
Miscellaneous

