

Mining the unknown: a systems approach to metabolite identification combining genetic and metabolic information
- PMID: 23093944
- PMCID: PMC3475673
- DOI: 10.1371/journal.pgen.1003005
Mining the unknown: a systems approach to metabolite identification combining genetic and metabolic information
Abstract
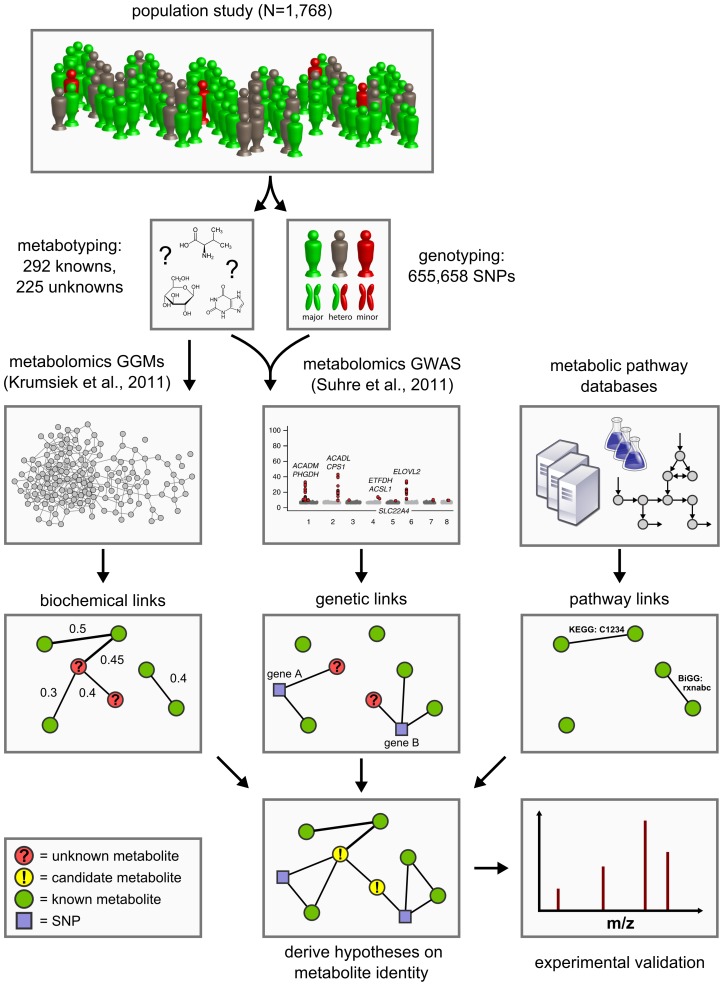
Recent genome-wide association studies (GWAS) with metabolomics data linked genetic variation in the human genome to differences in individual metabolite levels. A strong relevance of this metabolic individuality for biomedical and pharmaceutical research has been reported. However, a considerable amount of the molecules currently quantified by modern metabolomics techniques are chemically unidentified. The identification of these "unknown metabolites" is still a demanding and intricate task, limiting their usability as functional markers of metabolic processes. As a consequence, previous GWAS largely ignored unknown metabolites as metabolic traits for the analysis. Here we present a systems-level approach that combines genome-wide association analysis and Gaussian graphical modeling with metabolomics to predict the identity of the unknown metabolites. We apply our method to original data of 517 metabolic traits, of which 225 are unknowns, and genotyping information on 655,658 genetic variants, measured in 1,768 human blood samples. We report previously undescribed genotype-metabotype associations for six distinct gene loci (SLC22A2, COMT, CYP3A5, CYP2C18, GBA3, UGT3A1) and one locus not related to any known gene (rs12413935). Overlaying the inferred genetic associations, metabolic networks, and knowledge-based pathway information, we derive testable hypotheses on the biochemical identities of 106 unknown metabolites. As a proof of principle, we experimentally confirm nine concrete predictions. We demonstrate the benefit of our method for the functional interpretation of previous metabolomics biomarker studies on liver detoxification, hypertension, and insulin resistance. Our approach is generic in nature and can be directly transferred to metabolomics data from different experimental platforms.
Conflict of interest statement
AME, MWM, RPM, and MVM are employees of Metabolon. A patent application for the unknown identification method has been filed: “Identity Elucidation of Unknown Metabolites,” U.S. Patent Application No. 61503673, unpublished – filing date July 1, 2011 (MVM, applicant).
Figures

 = 1.6×10⁻¹⁰ corresponding to α = 0.05 after Bonferroni correction); red vertical dashes indicate loci at which this threshold is attained.


Similar articles
-
Automated pathway and reaction prediction facilitates in silico identification of unknown metabolites in human cohort studies.J Chromatogr B Analyt Technol Biomed Life Sci. 2017 Dec 15;1071:58-67. doi: 10.1016/j.jchromb.2017.04.002. Epub 2017 Apr 4. J Chromatogr B Analyt Technol Biomed Life Sci. 2017. PMID: 28479069
-
Biochemical insights from population studies with genetics and metabolomics.Arch Biochem Biophys. 2016 Jan 1;589:168-76. doi: 10.1016/j.abb.2015.09.023. Epub 2015 Oct 9. Arch Biochem Biophys. 2016. PMID: 26432701 Review.
-
A network-based conditional genetic association analysis of the human metabolome.Gigascience. 2018 Dec 1;7(12):giy137. doi: 10.1093/gigascience/giy137. Gigascience. 2018. PMID: 30496450 Free PMC article.
-
Merging metabolomics and genomics provides a catalog of genetic factors that influence molecular phenotypes in pigs linking relevant metabolic pathways.Genet Sel Evol. 2025 Mar 6;57(1):11. doi: 10.1186/s12711-025-00960-8. Genet Sel Evol. 2025. PMID: 40050712 Free PMC article.
-
Metabolome 2.0: quantitative genetics and network biology of metabolic phenotypes.Mol Biosyst. 2012 Oct;8(10):2494-502. doi: 10.1039/c2mb25167a. Mol Biosyst. 2012. PMID: 22868675 Review.
Cited by
-
Deployment-Associated Exposure Surveillance With High-Resolution Metabolomics.J Occup Environ Med. 2016 Aug;58(8 Suppl 1):S12-21. doi: 10.1097/JOM.0000000000000768. J Occup Environ Med. 2016. PMID: 27501099 Free PMC article.
-
Assessing the Causal Effects of Human Serum Metabolites on 5 Major Psychiatric Disorders.Schizophr Bull. 2020 Jul 8;46(4):804-813. doi: 10.1093/schbul/sbz138. Schizophr Bull. 2020. PMID: 31919502 Free PMC article.
-
Urinary proteomics and metabolomics studies to monitor bladder health and urological diseases.BMC Urol. 2016 Mar 22;16:11. doi: 10.1186/s12894-016-0129-7. BMC Urol. 2016. PMID: 27000794 Free PMC article. Review.
-
Early Diagnosis of Sepsis: Is an Integrated Omics Approach the Way Forward?Mol Diagn Ther. 2017 Oct;21(5):525-537. doi: 10.1007/s40291-017-0282-z. Mol Diagn Ther. 2017. PMID: 28624903 Free PMC article. Review.
-
Whole Genome Association Study of the Plasma Metabolome Identifies Metabolites Linked to Cardiometabolic Disease in Black Individuals.Nat Commun. 2022 Aug 22;13(1):4923. doi: 10.1038/s41467-022-32275-3. Nat Commun. 2022. PMID: 35995766 Free PMC article.
References
-
- Gieger C, Geistlinger L, Altmaier E, de MH, Kronenberg F, et al. (2008) Genetics meets metabolomics: a genome-wide association study of metabolite profiles in human serum. PLoS Genet 4: e1000282 doi:10.1371/journal.pgen.1000282 - DOI - PMC - PubMed
-
- Suhre K, Wallaschofski H, Raffler J, Friedrich N, Haring R, et al. (2011) A genome-wide association study of metabolic traits in human urine. Nat Genet 43: 565–569. - PubMed
-
- Nicholson G, Rantalainen M, Li JV, Maher AD, Malmodin D, et al. (2011) A genome-wide metabolic QTL analysis in Europeans implicates two loci shaped by recent positive selection. PLoS Genet 7: e1002270 doi:10.1371/journal.pgen.1002270 - DOI - PMC - PubMed
Publication types
MeSH terms
LinkOut - more resources
Full Text Sources
Other Literature Sources
Research Materials
Miscellaneous
