. 2012;7(10):e47480.
doi: 10.1371/journal.pone.0047480. Epub 2012 Oct 19.

Exosomal lipids impact notch signaling and induce death of human pancreatic tumoral SOJ-6 cells

Affiliations

Exosomal lipids impact notch signaling and induce death of human pancreatic tumoral SOJ-6 cells

Sadia Beloribi et al. PLoS One. 2012.

Abstract

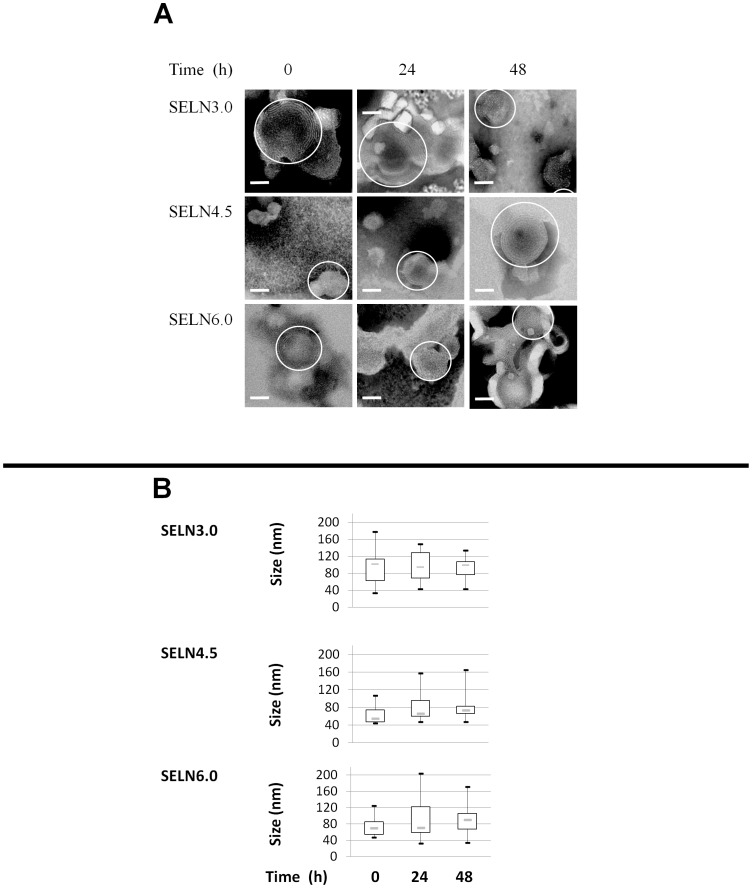
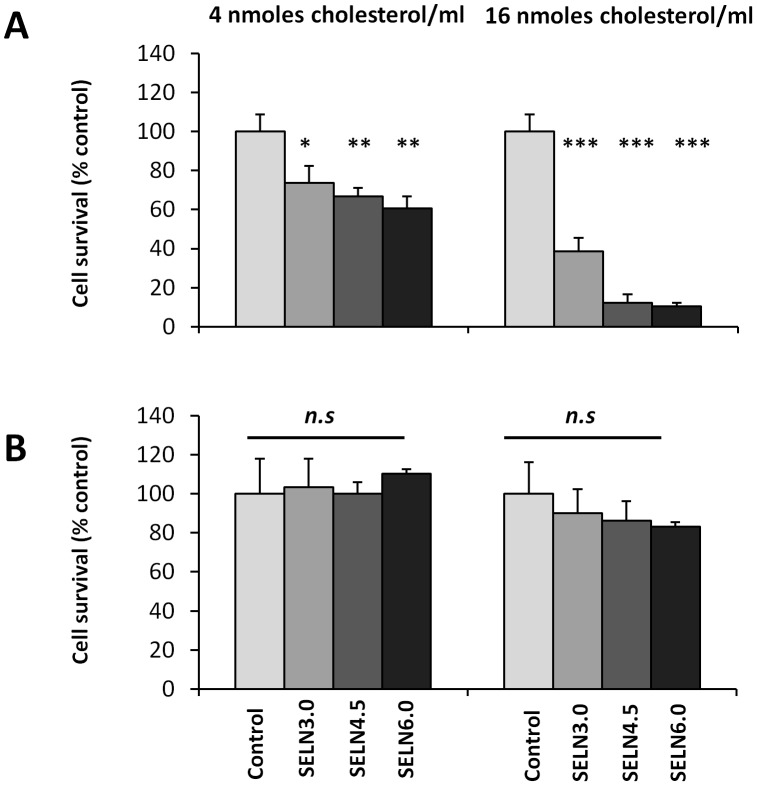
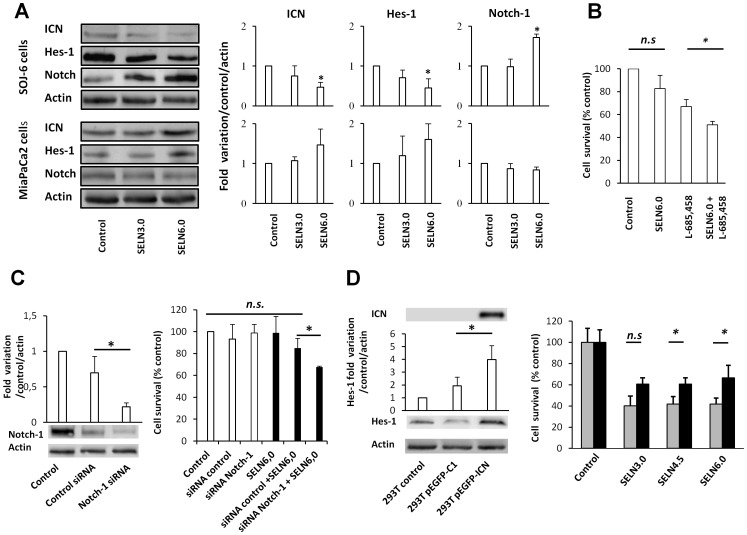
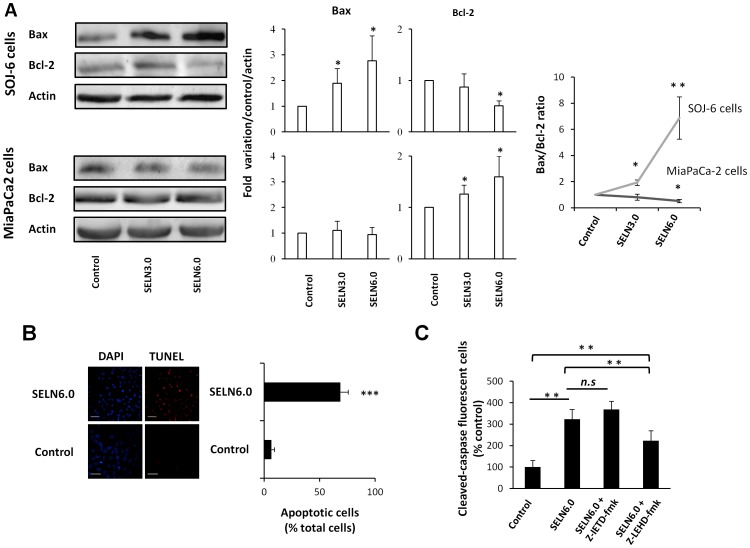
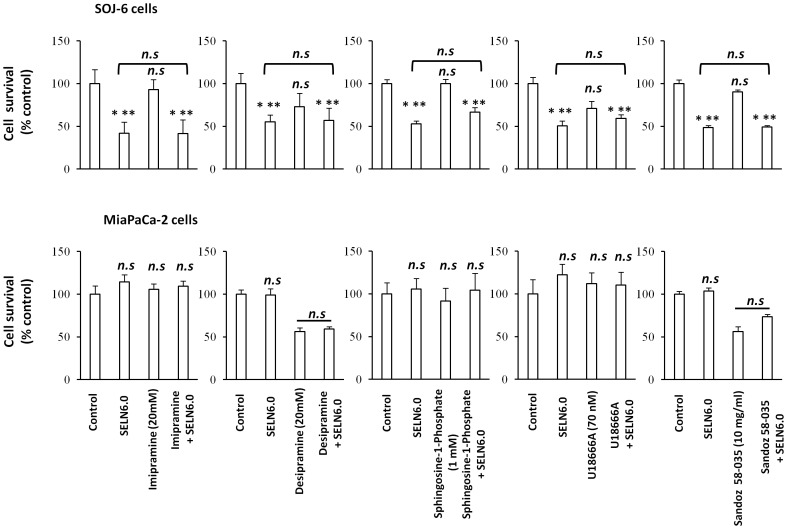
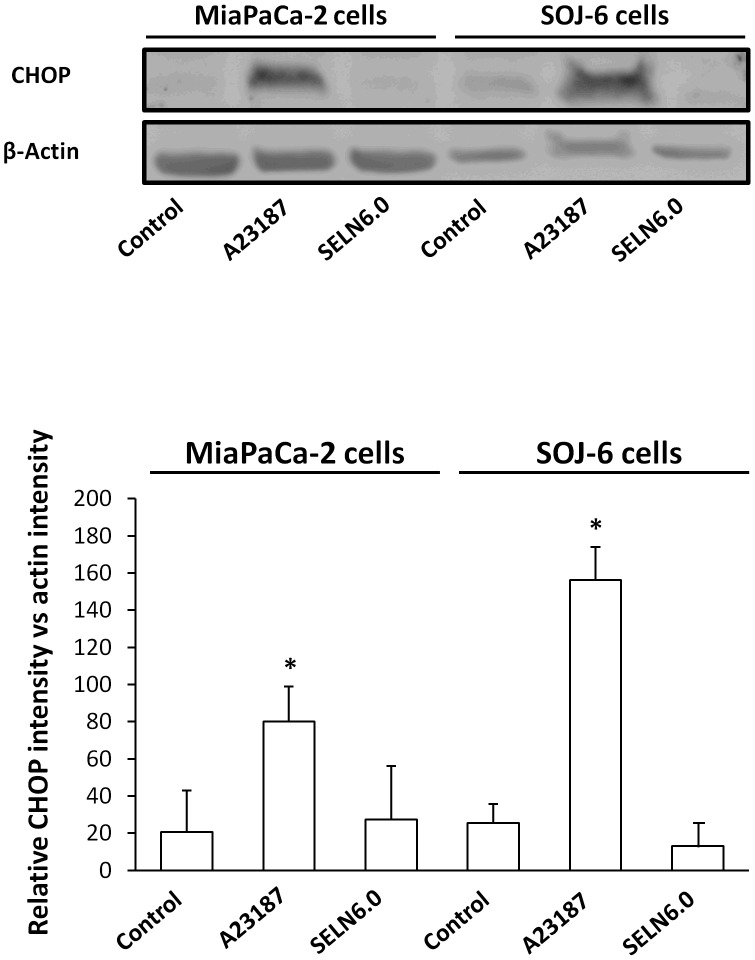
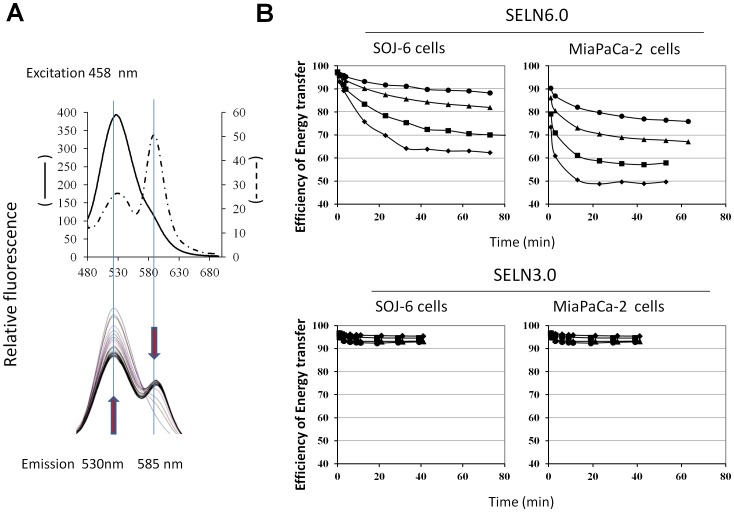
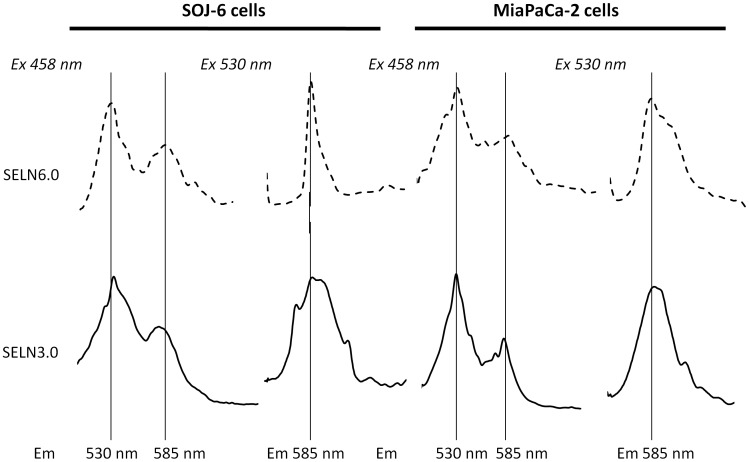
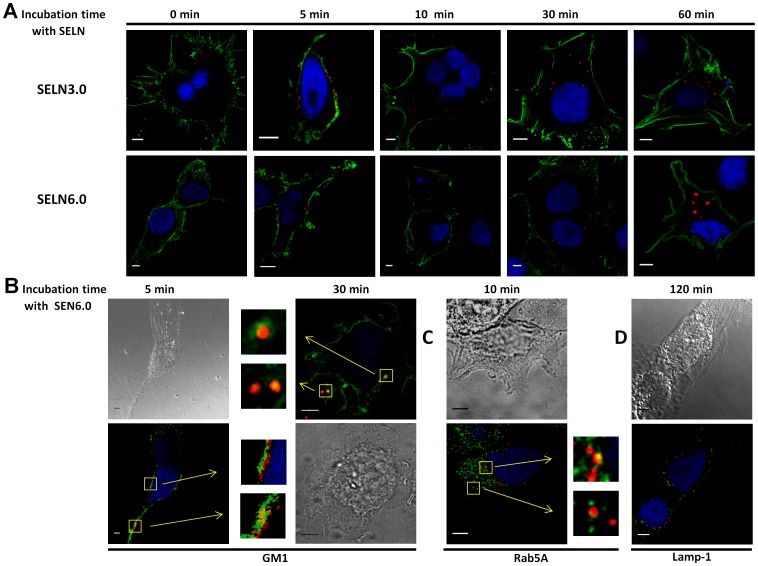
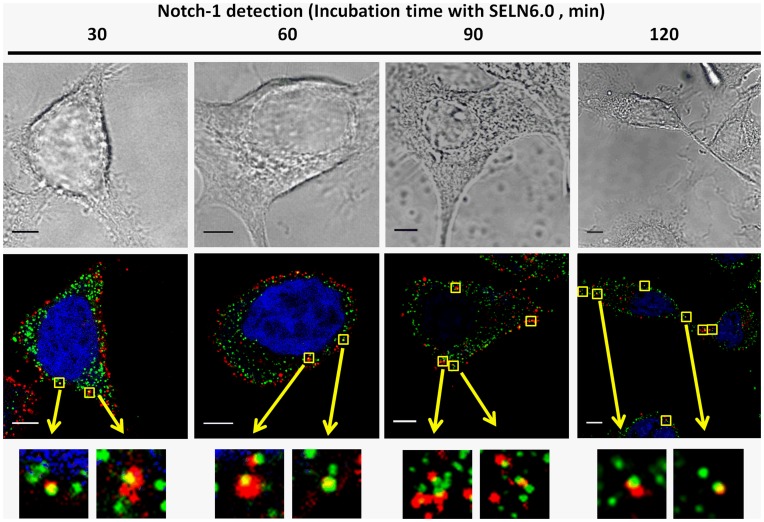
Exosomes are of increasing interest as alternative mode of cell-to-cell communication. We previously reported that exosomes secreted by human SOJ-6 pancreatic tumor cells induce (glyco)protein ligand-independent cell death and inhibit Notch-1 pathway, this latter being particularly active during carcinogenesis and in cancer stem cells. Therefore, we asked whether exosomal lipids were key-elements for cell death and hypothesized that cholesterol-rich membrane microdomains were privileged sites of exosome interactions with tumor cells. To address these questions and based on the lipid composition of exosomes from SOJ-6 cells (Ristorcelli et al. (2008) FASEB J. 22; 3358-3369) enriched in cholesterol and sphingomyelin (lipids forming liquid-ordered phase, Lo) and depleted in phospholipids (lipids forming liquid-disordered phase, Ld), we designed Synthetic Exosome-Like Nanoparticles (SELN) with ratios Lo/Ld from 3.0 to 6.0 framing that of SOJ-6 cell exosomes. SELN decreased tumor cell survival, the higher the Lo/Ld ratio, the lower the cell survival. This decreased survival was due to activation of cell death with inhibition of Notch pathway. FRET analyses indicated fusions/exchanges of SELN with cell membranes. Fluorescent SELN co-localized with the ganglioside GM1 then with Rab5A, markers of lipid microdomains and of early endosomes, respectively. These interactions occurred at lipid microdomains of plasma and/or endosome membranes where the Notch-1 pathway matures. We thus demonstrated a major role for lipids in interactions between SELN and tumor cells, and in the ensued cell death. To our knowledge this is the first report on such effects of lipidic nanoparticles on tumor cell behavior. This may have implications in tumor progression.


Conflict of interest statement

Competing Interests: The authors declare no conflict of interest.

Figures

Figure 1
Figure 1. Synthetic exosome-like nanoparticles (SELN).
(A) Synthetic exosome-like nanoparticles (SELN) were examined by electron microscopy. SELN3.0, SELN4.5 and SELN6.0 preparations were incubated at room temperature, then 3 µl were removed at 0, 24 h and 48 h. SELN were then disposed on top of Formvar-coated 300-mesh carbon grids and treated with 2% phosphotungstic acid. Several fields were photographed and used to determine the diameter of SELN. Scale bars on microphotographs represent 50 nm. (B) The range of observed diameters for lipid structures as represented in A was statistically represented by the box plot. The dashed line inside the box represents the median diameter of SELN (n = 20). The box represents the interquartile range (50% of values). Tails extend to values within 1.5 times the interquartile range.
Figure 2
Figure 2. Survival of SOJ-6 and MiaPaCa-2 cells in the presence of SELN.
SOJ-6 (A) and MiaPaCa-2 (B) cells were starved and incubated for 24 h with SELN (left panel; 4 nmoles of cholesterol/ml, right panel; 16 nmoles of cholesterol/ml). Cell survival was determined by MTT assay. Results are mean (± SD) of independent experiments (n = 32, Student’s t-test).
Figure 3
Figure 3. Effect of SELN on Notch pathway.
(A) SOJ-6 and MiaPaCa-2 cells were starved then treated for 24 h with SELN (16 nmoles cholesterol/ml) and lysed. Cell lysate proteins were separated on SDS-PAGE (80 µg of proteins/lane) and electrotransferred onto nitrocellulose membrane. The levels of ICN, Hes-1, Notch-1 and β-actin were determined by probing membranes with specific antibodies as indicated. Western blots are representative of three independent experiments. Lane 1, control performed in the absence of SELN, Lane 2, in the presence of SELN 3.0, Lane 3, in the presence of SELN 6.0. The right panels in figure 3A represents the quantification of western blots (means (± SD) of three independent experiments) using the NIH Image program (Mann-Whitney test). (B) MiaPaCa-2 cells were incubated with medium (control), with L-685,458 γ-secretase inhibitor (GSI, 2.5 µM), with SELN6.0 (16 nmoles of cholesterol/ml), with SELN6.0 and GSI. The L-685,458 GSI was added 60 min before freshly prepared SELN6.0. Cells were further incubated for 24 h in the presence of each component and cell proliferation was determined. Results are means (± SD) of independent experiments (n = 36, Student’s t-test). (C) MiaPaCa2 cells were transfected with a mix of Notch-1 siRNA or with a control siRNA. In the left panel cell lysate proteins (50 µg of proteins) of parental, control and Notch-1 siRNA transfected MiaPaCa-2 cells were separated on SDS-PAGE and analyzed by western blotting (72 h post-transfection). The histogram indicates quantification of western blots. In the right panel cell survival of parental and transfected MiaPaCa-2 cells was assessed through a MTT test after 24 hours of incubation with (black columns) or without (white columns) SELN6.0. The proliferation of MiaPaCa-2 cells recorded in the absence of SELN was taken as 100%. Results are means (± SD) of three independent experiments (Mann-Whitney test). (D, left panel) HEK 293 T cells were transiently transfected with the pEGFP-C1 control plasmid or pEGFP-ICN plasmid encoding ICN (Notch-1 intracellular domain). Cell lysate proteins of parental and transfected HEK 293T cells were separated on SDS-PAGE and analyzed by western blotting using primary antibodies as indicated. Western blotting replicates depicted the expression level of ICN and the nuclear target of ICN, Hes-1, in parental (293T control), pEGFP-C1 control vector-transfected (293TpEGFP-C1) and pEGFP-ICN-transfected (293TpEGFP-ICN) HEK 293T cells. The amount of loaded proteins was the same (50 µg) for each lane as indicated by β-actin probing. The histogram displays the quantification of Hes-1 as determined from western blots. (D, right panel) HEK 293TpEGFP-C1-transfected cells (grey columns) and HEK 293TpEGFP-ICN-transfected cells (black columns) were challenged without (control) or with SELN3.0, SELN4.5 and SELN6.0 (16 nmoles cholesterol/ml) for 24 h. Cell survival was determined with MTT. The proliferation of HEK 293T cells transfected with the control vector (293TpEGFP-C1) recorded in the absence of SELN was taken as 100%. Values are means ± SD of three independent experiments (Mann-Whitney test).
Figure 4
Figure 4. Effect of SELN on apoptosis.
(A) SOJ-6 and MiaPaCa-2 cells were starved then treated for 24h with SELN (16 nmoles cholesterol/ml) and lysed. Cell lysate proteins were separated on SDS-PAGE (80 µg of proteins/lane) and electrotransferred onto nitrocellulose membrane. The levels of Bax, Bcl-2 and β-actin were determined by probing membranes with specific antibodies as indicated. Western blots are representative of three independent experiments. Lane 1; control performed in the absence of SELN, Lane 2; in the presence of SELN 3.0, Lane 3; in the presence of SELN 6.0. The right panels in figure 4A represents the quantification of western blots and the ratio Bax/Bcl-2. Data are means (± SD) of three independent experiments using the NIH Image program (Mann-Whitney test). (B) Apoptosis was determined using the Terminal Transferase dUTP Nick End Labeling (TUNEL). SOJ-6 cells were starved then treated with SELN6.0 (16 nmoles cholesterol/ml) for 24h then fragmented DNA was stained according to the protocol given with the ApopTag® Red In Situ Apoptosis Detection Kit (right pictures). Nuclei were counterstained with DAPI (left pictures). Apoptotic cells were visualized under a Zeiss fluorescence microscope equipped with a digital camera. The ratio of apoptotic cells to total cells was counted in 5-to-10 random area, in both control and SELN6.0 treated SOJ-6 cells (right histogram, (means (± SD) of three independent experiments, Mann-Whitney test), scale bar = 100 µm. (C) SOJ-6 cells were incubated 4 h with medium (control), with SELN6.0 (16 nmoles of cholesterol/ml, column 2), with SELN6.0 and Z-IETD-fmk (a caspase-8 inhibitor, 10 µM, column 3) or Z-LEHD-fmk (a caspase-9 inhibitor, 10 µM, column 4). After adding freshly prepared SELN6.0, cells were incubated for another 24h. After washing and fixation, cleaved caspase-positive cells were counted under fluorescent microscopy. Results are means (± SD) of fluorescent cell amounts collected in 10 fields per assay (at least 3 independent assays). Results are expressed as percentage of cleaved caspase-positive cells relatively to controls (Mann-Whitney test).
Figure 5
Figure 5. Effect of SELN on PTEN and GSK-3β phosphorylation.
(A) SOJ-6 and MiaPaCa-2 cells were starved then treated for 24h with SELN (16 nmoles cholesterol/ml) and lysed. Cell lysate proteins were separated on SDS-PAGE (80 µg of proteins/lane) and electrotransferred onto nitrocellulose membrane. The levels of PTEN, Ser380-phosphorylated PTEN (p-PTEN) GSK-3β, Ser9-phosphorylated GSK-3β (p-GSK-3β) and β-actin were determined by probing membranes with specific antibodies as indicated. Western blots are representative of three independent experiments. Lane 1, control performed in the absence of SELN, Lane 2, in the presence of SELN 3.0, Lane 3, in the presence of SELN 6.0. The right panels in figure 5A represents the quantification of western blots. (B) Ratios of Ser380-phosphorylated PTEN (p-PTEN) to total PTEN and Ser9-phosphorylated GSK-3β (p-GSK-3β) to total GSK-3β determined from A. Results are means (± SD) of three independent experiments using the NIH Image program (Mann-Whitney test).
Figure 6
Figure 6. Proliferation of MiaPaCa-2 and SOJ-6 cells in the presence of drugs.
MiaPaCa-2 and SOJ-6 cells were incubated 1h with drugs affecting lipid metabolism at the indicated concentration then SELN6.0 (16 nmoles cholesterol/ml) were added for 24h in the presence or absence (control) of drugs at indicated concentration. At the end of incubation, proliferation was measured by MTT assay and expressed as % of control. Results are means (± SD) of independent experiments, (n = 24, Student’s t-test).
Figure 7
Figure 7. SELN cholesterol and UPR response.
MiaPaCa2 and SOJ-6 cells were starved then incubated for 24h in the presence of the UPR inducer calcium ionophore A23187 (2.5 µg/ml), in the presence of SELN6.0 (16 nmoles cholesterol/ml) and in the absence of effector (control). At the end of the incubation cells were lysed and proteins were separated on SDS-PAGE (100 µg of proteins/lane) and electrotransferred onto nitrocellulose membrane. After saturation, membranes were incubated with primary antibodies to CHOP or β-actin and with the POD-labelled antibodies to mouse IgG. The upper part displays a typical western blotting, the lower diagrams are averages of western blotting quantification (± SD) of three independent experiments (Mann-Whitney test).
Figure 8
Figure 8. SELN interactions with SOJ-6 and with MiaPaCa-2 cells.
(A) Left spectrum depicts a typical FRET obtained with SELN6.0 labeled with N-NBD-PE and N-Rh-PE. Once excited at 458 nm, N-NBD-PE transfers energy to N-Rh-PE generating light emission at 585 nm (dashed line curve, upper panel). When SELN6.0 preparation was diluted in a micellar solution of detergent (Tween 20, 1% final) the FRET depicted by the 585 nm emission peak disappears to favor N-NBD-PE maximal emission (f0) at 530 nm (single line curve, in upper panel). The lower panel shows typical variation of fluorescence emission (following excitation at 435 nm) of SELN6.0 (50 µl) in the presence of 1.0×10⁶ SOJ-6 cells. Arrows indicate variations in fluorescence emission with time (0 min up to 60 min, 3 min steps). (B) Variation with time of the energy transfer efficacy E = 1-(f/f0) when cells were mixed with SELN. f0 is determined at the end of each experiment (see A). Typical data obtained with : • 0.25×10⁶, ▴ 0.5×10⁶, ▪ 1.0×10⁶, and ♦ 2.0×10⁶ cells.
Figure 9
Figure 9. Cell fluorescence upon incubation with fluorescent SELN.
SOJ-6 and MiaPaCa-2 cells (0.5×10⁶ cells) were suspended in 2 ml (final volume) of PBS and incubated for 90 min (25°C) with 50 µl SELN3.0 and SELN6.0 (4 nmoles cholesterol/ml). Cells were then pelleted and washed with PBS (twice) and finally suspended in 2 ml PBS before fluorescence analysis after excitation at 458 nm (left peaks) or at 530 nm (right peaks). The self-fluorescence of cells was subtracted from given spectra.
Figure 10
Figure 10. Fluorescent SELN incorporation.
(A) SOJ-6 cells were seeded on 1.4 cm-diameter cover slips in 12-wells plate, once adherent cells were starved for 24h before incubation with SELN3.0 or SELN6.0 (8 to 10 µl of SELN solution corresponding to 1.6 nmol cholesterol in 100 µl culture medium). SELN used in this experiment were only loaded with N- Rh-PE. Cells were incubated for 0, 5, 10, 30 and 60 min with N- Rh-PE-loaded SELN. At the end of the incubation time cells were washed with PBS and then fixed and saturated, nuclei were blue-colored with Draq5 (1 µM, 10 min, 37°C) and saturated with 1% BSA. Cell plasma membranes were further labelled with mAb16D10, a monoclonal antibody which binds to the tumor cell membrane antigen 16D10 . mAb16D10 is then detected using a secondary antibody to IgM, coupled to FITC. Examination was performed using a SP5 Leica confocal microscope (Scale bar = 5 µm). (B) Plasma membrane lipid microdomains were visualized via the binding of the cholera toxin subunit B (CT-B) to raft ganglioside GM1. SOJ-6 cells were grown in complete DMEM medium, incubated with SELN6-Rh-PE (5 min, 37°C in FCS-depleted DMEM) before washing twice. Cells were then fixed with PFA, and nuclei were blue-colored with Draq5. Fixed cells were washed and incubated with the CT-B (0.5 µg/ml final concentration, 10 min, 4°C) before washed and incubated with Alexa Fluor 488–conjugated antibodies against CT-B (15 min, 4°C) (GM1, 5 min). To detect the intracellular localization of the CT-B, cells were first incubated with CT-B (see above), washed, and incubated with Alexa Fluor 488–conjugated antibodies against CT-B, before incubation with SELN6.0-Rh-PE, during 30 min at 37°C. Finally cells were fixed with PFA and then nuclei labelled with Draq5 (GM1, 30 min). (C, D) SOJ-6 cells were treated as in A and incubated (for the indicated time) with SELN6.0 labelled with N-Rh-PE (1.6 nmol cholesterol/100 µl culture medium). Cells were fixed with PFA and nuclei labelled with Draq5. Cells were permeabilized with saponin (0.1%, 30 min at room temperature), saturated (BSA, 1%, 30 min at room temperature) and incubated with antibodies (C) to early-endosome marker Rab5A, or (D) to late endosome marker Lamp-1 and further detected with an Alexa Fluor 488-labelled secondary antibodies. In B and C, squares indicate co-localization (yellow) and arrows indicate enlarged areas (inserts) where GM1, or Rab5A co-localizes with N- Rh-PE labelled SELN6.0 (Scale bar = 5 µm).
Figure 11
Figure 11. Co-localization of Fluorescent SELN6.0 with Notch-1 in SOJ6 cells.
SOJ-6 cells were treated as in Fig. 10 and incubated (for the indicated times) with N- Rh-PE-loaded SELN 6.0 (1.6 nmol cholesterol/100 µl culture medium). Cells were fixed with PFA, permeabilized, saturated and nuclei labelled with Draq5. Cells were then incubated with antibodies to Notch-1 (extracellular domain) and further detected with Alexa Fluor 488-labelled secondary antibodies. Squares indicate co-localization (yellow) and arrows indicate enlarged area (inserts) where Notch-1 co-localizes with N- Rh-PE labelled SELN6.0 (Scale bar = 5 µm).

References

    1. Schorey JS, Bhatnagar S (2008) Exosome function: from tumor immunology to pathogen biology. Traffic 9: 871–881. - PMC - PubMed
    1. van Niel G, Porto-Carreiro I, Simoes S, Raposo G (2006) Exosomes: a common pathway for a specialized function. J Biochem 140: 13–21. - PubMed
    1. Mathivanan S, Ji H, Simpson RJ (2010) Exosomes: extracellular organelles important in intercellular communication. J Proteomics 73: 1907–20. - PubMed
    1. Février B, Raposo G (2004) Exosomes: endosomal-derived vesicles shipping extracellular messages Curr Opin Cell Biol. 16: 415–421. - PubMed
    1. Nieuwland R, Sturk A (2010) Why do cells release vesicles? Thromb Res 125 Suppl 1 S49–51. - PubMed

Publication types

MeSH terms