. 2012;13 Suppl 14(Suppl 14):S13.
doi: 10.1186/1471-2105-13-S14-S13. Epub 2012 Sep 7.

High-Throughput parallel blind Virtual Screening using BINDSURF

Affiliations

High-Throughput parallel blind Virtual Screening using BINDSURF

Irene Sánchez-Linares et al. BMC Bioinformatics. 2012.

Abstract

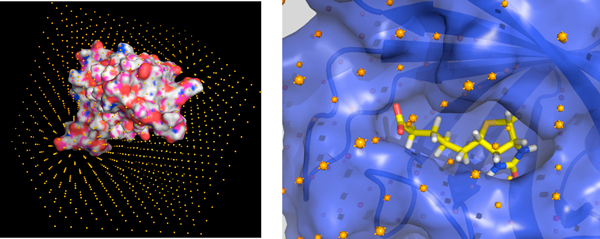
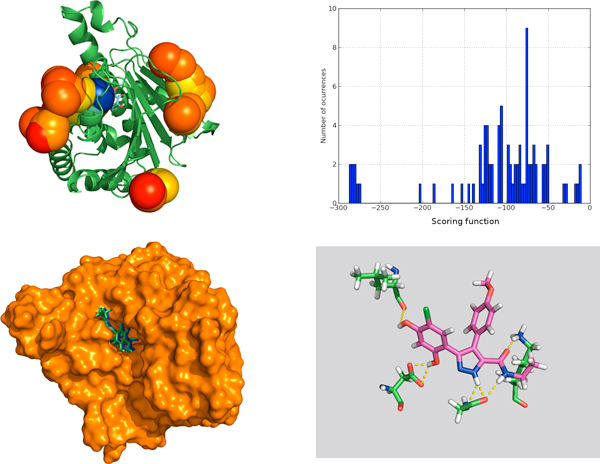
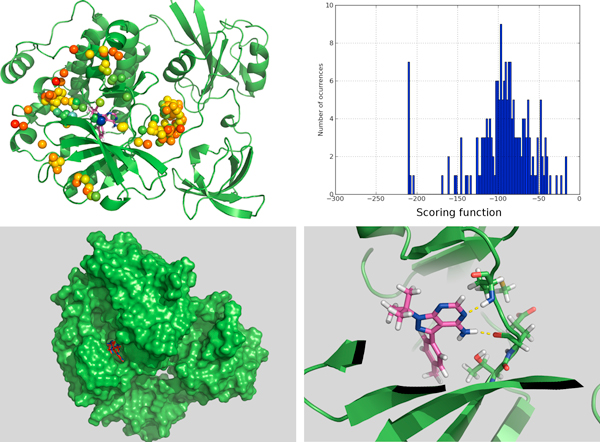
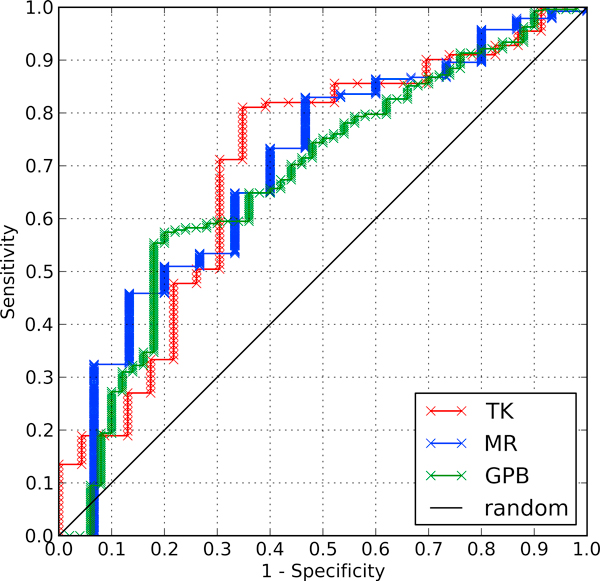
Background: Virtual Screening (VS) methods can considerably aid clinical research, predicting how ligands interact with drug targets. Most VS methods suppose a unique binding site for the target, usually derived from the interpretation of the protein crystal structure. However, it has been demonstrated that in many cases, diverse ligands interact with unrelated parts of the target and many VS methods do not take into account this relevant fact.

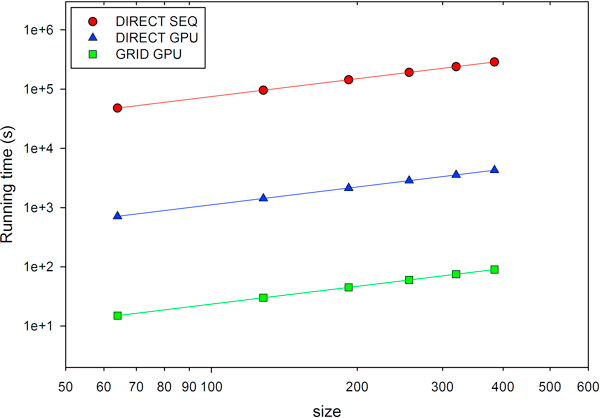
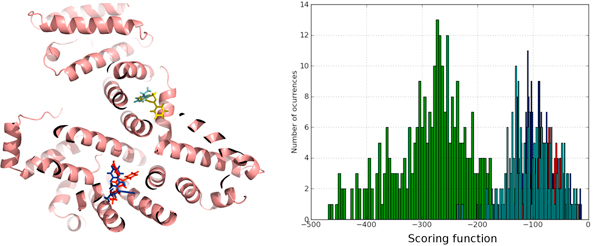
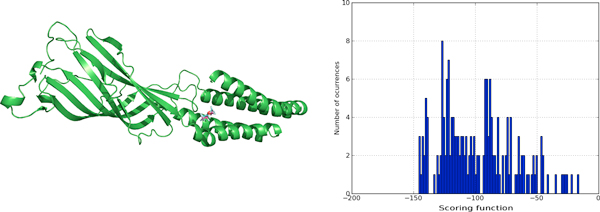
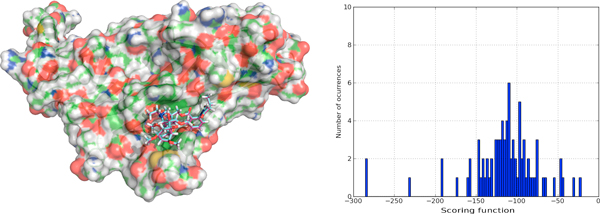
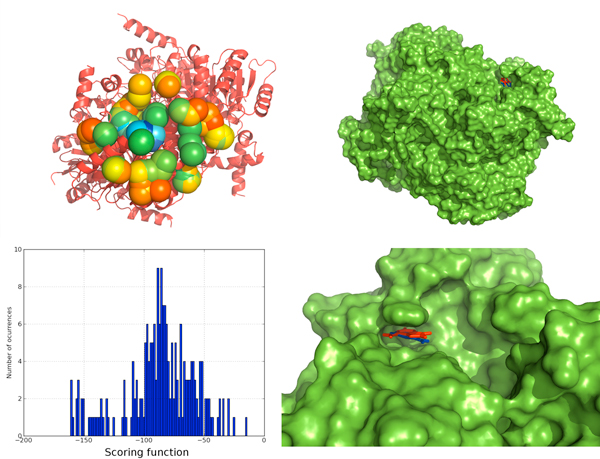
Results: We present BINDSURF, a novel VS methodology that scans the whole protein surface in order to find new hotspots, where ligands might potentially interact with, and which is implemented in last generation massively parallel GPU hardware, allowing fast processing of large ligand databases.

Conclusions: BINDSURF is an efficient and fast blind methodology for the determination of protein binding sites depending on the ligand, that uses the massively parallel architecture of GPUs for fast pre-screening of large ligand databases. Its results can also guide posterior application of more detailed VS methods in concrete binding sites of proteins, and its utilization can aid in drug discovery, design, repurposing and therefore help considerably in clinical research.


Figures

Figure 1
Figure 1
Grid for streptavidin. (A) Representation of the grid for the protein streptavidin. (B) Biotin in the crystallographic binding site of streptavidin.
Figure 2
Figure 2
Performance of BINDSURF. Running times for the different implementations of BINDSURF, when performing surface screening over the protein PDB:1M54 and increasing the number of processed spots, specified by the parameter size. SEQ and GPU denote sequential and GPU versions respectively. DIRECT and GRID refer to the respective kernels.
Figure 3
Figure 3
Surface screening results for PDB:2BSM. Surface screening results for PDB:2BSM. From up left to down right; a) beads represent protein spots and the color of each bead is related with the value of the scoring function, so colors from red to blue indicate lower values for the scoring function, b) histogram with the distribution of scoring function values, c) green and blue molecules represent crystallographic and predicted pose for the ligand, RMSD is lower than 1 Angstrom, and d) depiction of the hydrogen bonds established by the ligand with the closest residues.
Figure 4
Figure 4
Surface screening results for PDB:1QCF. Surface screening results for PDB:1QCF. From up left to down right; a) beads represent protein spots and the color of each bead is related with the value of the scoring function, so colors from red to blue indicate lower values for the scoring function, b) histogram with the distribution of scoring function values, c) red and blue molecules represent crystallographic and predicted pose for the ligand, RMSD is lower than 1 Angstrom, and d) depiction of the hydrogen bonds established by the ligand with the closest residues.
Figure 5
Figure 5
Surface screening results for proteins PDB:2BXB, PDB:2BXD, PDB:2BXF, PDB:2BXG. Surface screening results for proteins PDB:2BXB, PDB:2BXD, PDB:2BXF, PDB:2BXG. From left to right; a) ligand poses predicted by BINDSURF for the ligands of proteins PDB:2BXB (red color), PDB:2BXD (dark blue color), PDB:2BXF (yellow color) and PDB:2BXG (light blue color), with average RMSDs less than 2 Angstroms, and b) histogram with the distribution of scoring function values for PDB:2BXG (green color), PDB:2BXB (red color), PDB:2BXD (light blue color), and PDB:2BXF (dark blue color).
Figure 6
Figure 6
Surface screening results for PDB:3P4W. Surface screening results for PDB:3P4W. From left to right; a) superposition of predicted and crystallographic ligand poses, with RMSD less than 2 Angstroms, and b) histogram with the distribution of scoring function values.
Figure 7
Figure 7
Surface screening results for PDB:2BYR. Surface screening results for PDB:2BYR. From left to right; a) superposition of predicted and crystallographic ligand poses, with RMSD less than 3 Angstroms, and b) histogram with the distribution of scoring function values.
Figure 8
Figure 8
Surface screening results for PDB:1YXM. Surface screening results for PDB:1YXM. From up left to down right; a) beads represent protein spots and the color of each bead is related with the value of the scoring function, so colors from red to blue indicate lower values for the scoring function, b) representation of the PDB:1YXM protein surface, c) histogram with the distribution of scoring function values, d) red and blue molecules represent crystallographic and predicted pose for the ligand, RMSD is lower than 1 Angstrom.
Figure 9
Figure 9
Surface screening results for PDB:1F3A. Surface screening results for PDB:1F3A. From up left to down right; a) beads represent protein spots and the color of each bead is related with the value of the scoring function, so colors from red to blue indicate lower values for the scoring function, b) histogram with the distribution of scoring function values, c) red molecule represents predicted pose for the ligand, RMSD is lower than 1 Angstrom, and d) depiction of the hydrogen bonds established by the ligand with the closest residues.
Figure 10
Figure 10
ROC plots for DUD data sets. ROC plots for the targets of the DUD data set TK (red), MR (blue) and GPB (green). Diagonal line indicate random performance. Obtained values for AUC are 0.700, 0.695 and 0.675, respectively.

References

    1. Berman HM, Westbrook J, Feng Z, Gilliland G, Bhat TN, Weissig H, Shindyalov IN, Bourne PE. The Protein Data Bank. Nucleic Acids Res. 2000;28:235–242. doi: 10.1093/nar/28.1.235. - DOI - PMC - PubMed
    1. Sanchez R, Sali A. Large-Scale Protein Structure Modeling of the Saccharomyces cerevisiae Genome. Proc Natl Acad Sci USA. 1998;95(23):13597–13602. doi: 10.1073/pnas.95.23.13597. - DOI - PMC - PubMed
    1. Garland M, Kirk DB. Understanding throughput-oriented architectures. Commun ACM. 2010;53:58–66.
    1. Garland M, Le Grand S, Nickolls J, Anderson J, Hardwick J, Morton S, Phillips E, Zhang Y, Volkov V. Parallel Computing Experiences with CUDA. IEEE Micro. 2008;28:13–27.
    1. NVIDIA. Whitepaper NVIDIA's Next Generation CUDA Compute Architecture: Fermi. 2009.

Publication types

LinkOut - more resources