. 2012 Oct 24:12:30.
doi: 10.1186/1471-213X-12-30.

3D-FISH analysis of embryonic nuclei in mouse highlights several abrupt changes of nuclear organization during preimplantation development

Affiliations

3D-FISH analysis of embryonic nuclei in mouse highlights several abrupt changes of nuclear organization during preimplantation development

Tiphaine Aguirre-Lavin et al. BMC Dev Biol. .

Abstract

Background: Embryonic development proceeds through finely tuned reprogramming of the parental genomes to form a totipotent embryo. Cells within this embryo will then differentiate and give rise to all the tissues of a new individual. Early embryonic development thus offers a particularly interesting system in which to analyze functional nuclear organization. When the organization of higher-order chromatin structures, such as pericentromeric heterochromatin, was first analyzed in mouse embryos, specific nuclear rearrangements were observed that correlated with embryonic genome activation at the 2-cell stage. However, most existing analyses have been conducted by visual observation of fluorescent images, in two dimensions or on z-stack sections/projections, but only rarely in three dimensions (3D).

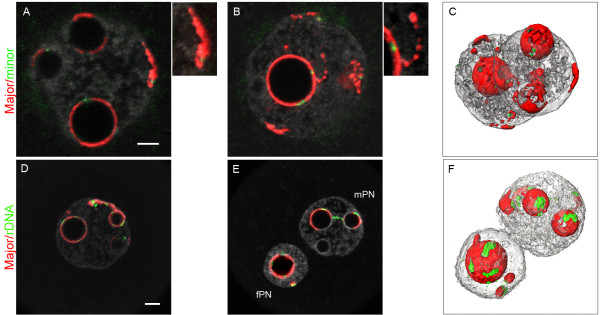
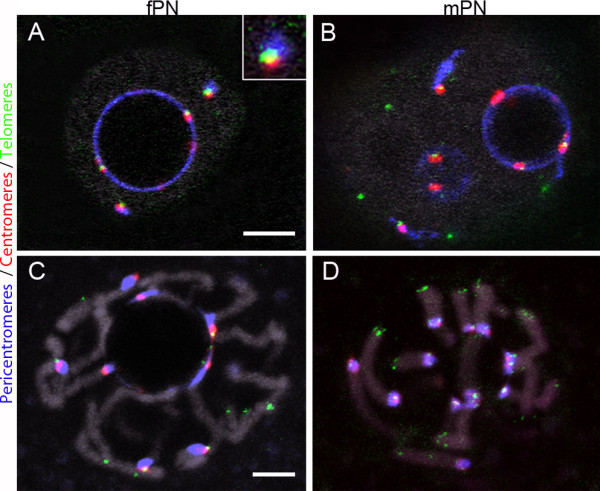
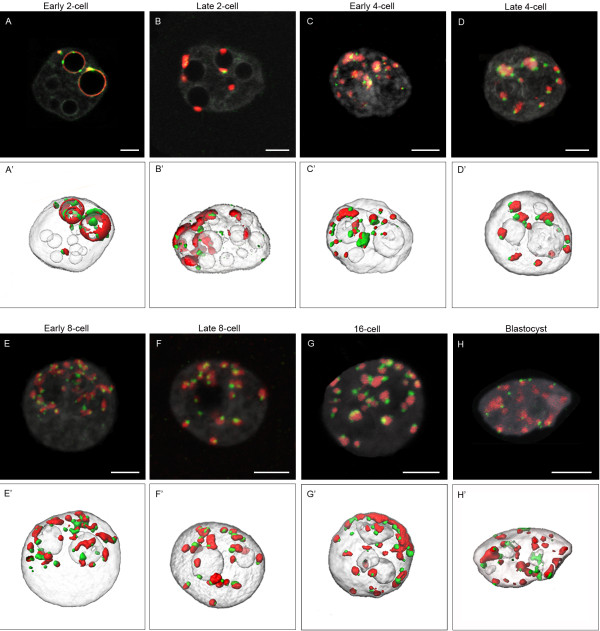
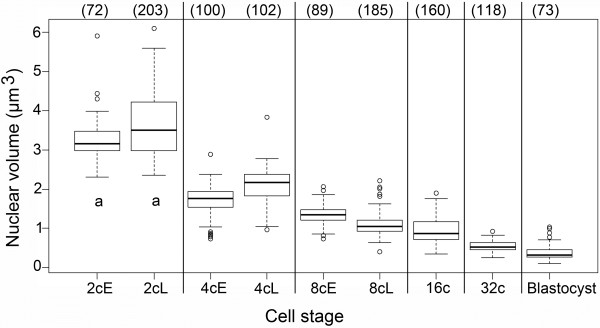
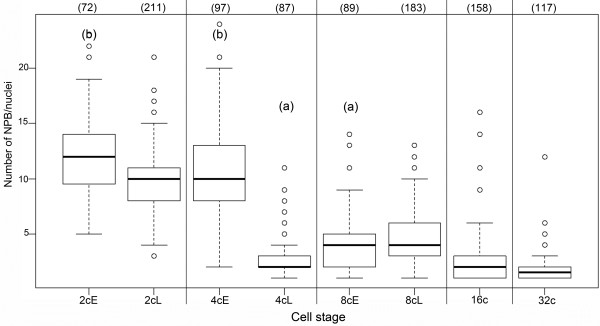
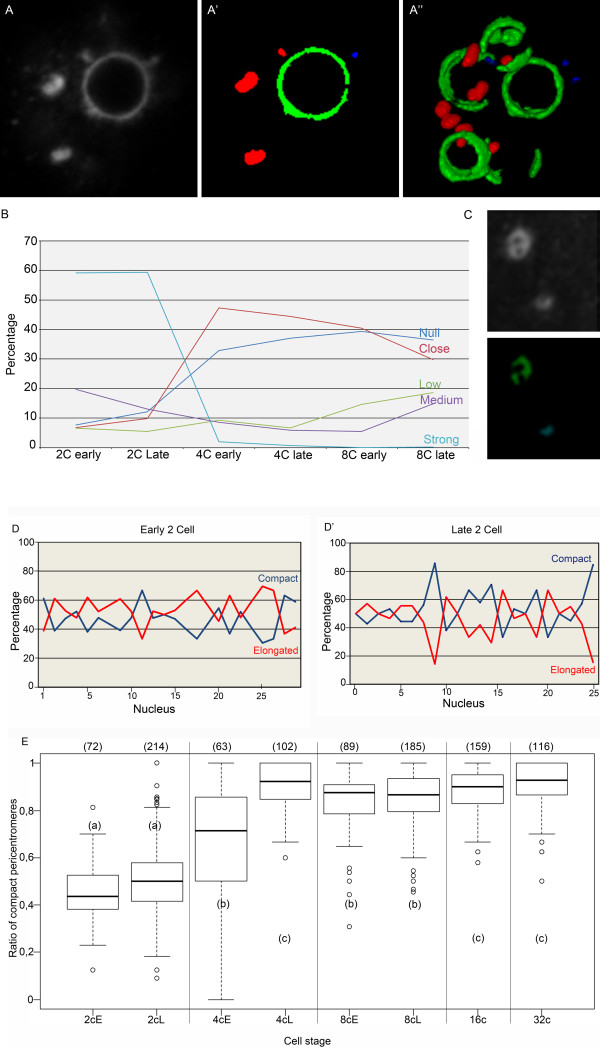
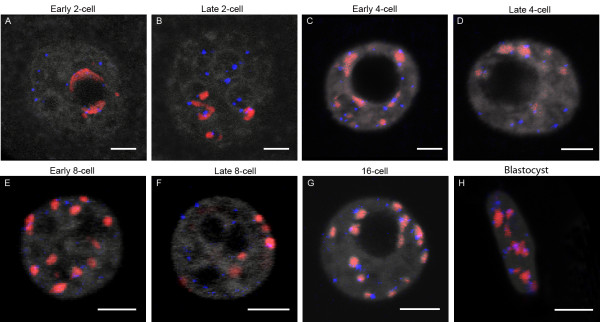
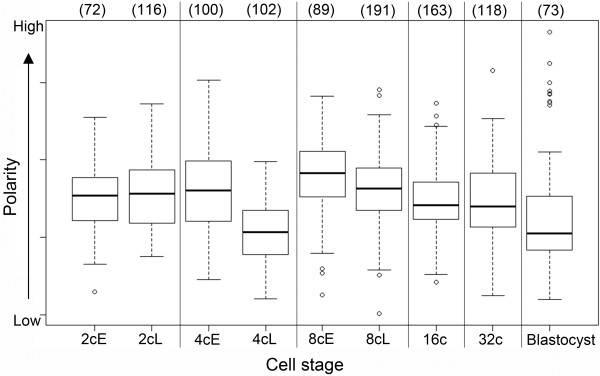
Results: In the present study, we used DNA fluorescent in situ hybridization (FISH) to localize centromeric (minor satellites), pericentromeric (major satellites), and telomeric genomic sequences throughout the preimplantation period in naturally fertilized mouse embryos (from the 1-cell to blastocyst stage). Their distribution was then analyzed in 3D on confocal image stacks, focusing on the nucleolar precursor bodies and nucleoli known to evolve rapidly throughout the first developmental stages. We used computational imaging to quantify various nuclear parameters in the 3D-FISH images, to analyze the organization of compartments of interest, and to measure physical distances between these compartments.

Conclusions: The results highlight differences in nuclear organization between the two parental inherited genomes at the 1-cell stage, i.e. just after fertilization. We also found that the reprogramming of the embryonic genome, which starts at the 2-cell stage, undergoes other remarkable changes during preimplantation development, particularly at the 4-cell stage.


Figures

Figure 1
Figure 1
Distribution of the pericentromeres, centromeres, and rDNA FISH signals in late 1-cell stage embryos. 1-cell embryos at the PN4 stage (collected at 27 hphCG) were processed with pericentromeric probes (red) and either centromeric (green, upper panel A/B/C) or rDNA probes (green, lower panel D/E/F). DNA was counterstained with Yopro-1 (grey). Upper panel: (A/B) In both PNs, pericentromeres form more or less complete shells around the NPBs, in which the centromeres are embedded. Pericentromeres are also found at the nuclear periphery, associated with centromeric signals (see enlargement of A), and can form filaments with a “beads on a string” appearance (see enlargement of B). (C) 3D reconstruction of the same nuclei. Lower panel: (D, E) Most of the rDNA signals are around the NPBs. However, there are occasionally some signals associated with pericentromeric filaments (extending from the NPBs towards the nuclear periphery) as well as rDNA signals joining two NPBs. (F) 3D reconstruction of E. Bar = 5 μm.
Figure 2
Figure 2
Distribution of telomeres in late 1-cell stage embryos. 3D-FISH was performed with telomeric (blue), pericentromeric (red), and centromeric (green) probes; DNA is in grey. (A, B) Single confocal images of PN5 embryos (collected at 27 hphCG). Telomeres are found 1) at the NPBs’ periphery, 2) associated with extra nucleolar centromeric/pericentromeric signals (A insert), or 3) free in the nucleoplasm (B). (C, D) In embryos at prophase (collected at 30 hphCG), the “cartwheel” organization of condensing chromosomes can be observed in both the fPN (C) and mPN (D). In C/D, four successive confocal sections were merged to improve chromosome visualization. Bars = 5 μm.
Figure 3
Figure 3
Distribution of pericentromeres and centromeres at different stages of mouse preimplantation development. Single confocal sections (A-H) of each preimplantation stage with pericentromeric (major satellite, red), centromeric (minor satellite, green), and DNA (grey) labeling are presented here, as well as the corresponding 3D reconstructions (A'-H'). (A, A') Example of an embryo at the early 2-cell stage. Pericentromeres and centromeres are essentially located at the periphery of NPBs, but some NPBs remain devoid of any signal. (B, B') In embryos at the late 2-cell stage, pericentromeric signals are now forming more spherical patches mostly associated to NPBs. The following images show embryos cultured up to the 4-cell (early C, C’ versus late D, D'), 8-cell (early E, E' versus late F, F’), 16-cell (G, G') and blastocyst (H, H’) stage. Pericentromeric and centromeric heterochromatin now forms chromocenters of heterogenous sizes and shapes. Note that at the blastocyst stage we randomly analyzed the trophectoderm cells and the inner cell mass. Bars = 5 μm.
Figure 4
Figure 4
Quantitative analysis of nuclear volume in preimplantation mouse embryos. Box plots of the nuclear volume at each developmental stage are presented, indicating the smallest observation (sample minimum), the lower quartile, the median value, the upper quartile, and the largest observation. The number of nuclei analyzed at each stage is indicated in brackets above the box plots. At the 2-cell, 4-cell, and 8-cell stages, early (E) and late (L) embryos have been analyzed separately. Differences in mean values between each stage are highly significant, with p < 0.0001 (no subscripts) or p < 0.001 (subscript a, early and late 2-cell stage).
Figure 5
Figure 5
Quantitative automated analysis of NPBs/nucleoli numbers in preimplantation mouse embryos. Box plots of the number of NPBs/nucleoli in 2-cell through 32-cell stages (early (E) and late (L) embryos have been analyzed separately at the 2-cell, 4-cell, and 8-cell stages). The number of nuclei analyzed at each stage is indicated in brackets above the box plots. Differences in mean values between each stage are highly significant, with p < 0.0001; significant between late 4-cell and 16-cell stages (subscript a), with p = 0.00125; and less significant between early 2-cell and early 4-cell stages (subscript b), with p = 0.0103. The difference between late 2-cell and early 4-cell stages as well as between 16-cell and 32-cell stages is not significant (p > 0.05).
Figure 6
Figure 6
Computerized analysis of pericentromere structures and organization in preimplantation mouse embryos. Panel A-A”: Segmentation and classification of the pericentromeric signals in a late 2-cell nucleus. (A) Original confocal section of the 3D-FISH analysis with the pericentromeric probe; (A’) Same confocal section after segmentation and classification into “compact” (red), “elongated” (green), or “non analyzed” (blue) signals; (A”) 3D reconstruction of the pericentromeric signals after segmentation and classification. Panel B: Proximity between elongated pericentromeres and NPBs/nucleoli was analyzed, and five different categories were distinguished: Null, Close, Low, Medium, and Strong. The graph represents the percentage of each group at 2-cell, 4-cell, and 8-cell stages. Panel C: Example of a pericentromeric signal classified as “elongated” through computerized analysis, although it would be classified as “compact” by visual analysis. Note the less intense “core” of this pericentromeric signal. Panel D-D’: Percentage of “compact” (blue) and “elongated” pericentromeres in several nuclei from early versus late 2-cell stage embryos. Panel E: Box plots representing the ratio of “compact” pericentromeres relative to the total observed pericentromeric signals from 2-cell to 32-cell stages (early (E) and late (L) embryos have been analyzed separately at the 2-cell, 4-cell, and 8-cell stages). The number of nuclei analyzed at each stage is indicated in brackets above the box plots. Differences in mean values between stages with different subscripts are highly significant (p < 0.0001) to significant (p = 0.0079).
Figure 7
Figure 7
Distribution of pericentromeres and telomeres at different stages of mouse preimplantation development. 3D-FISH was performed with telomeric (blue) and pericentromeric (red) probes; DNA is in grey. Representative single plane confocal images are presented for: early and late 2-cell embryos (A, B) early and late 4-cell (C, D), early and late 8-cell (E, F), 16-cell (G), and blastocysts (H). As expected, only half of the telomeres are associated with pericentromeric signals. . Note that at the blastocyst stage we randomly analyzed the trophectoderm cells and the inner cell mass. B. Bars = 5μm.
Figure 8
Figure 8
Computerized analysis of nuclear polarity in preimplantation mouse embryos. Box plots represent the nuclear polarity evaluation at each developmental stage from 2-cell to blastocyst (early (E) and late (L) embryos have been analyzed separately at the 2-cell, 4-cell, and 8-cell stages). The number of nuclei analyzed at each stage is indicated in brackets above the box plots.

References

    1. Lanctôt C, Cheutin T, Cremer M, Cavalli G, Cremer T. Dynamic genome architecture in the nuclear space: regulation of gene expression in three dimensions. Nat Rev Genet. 2007;8:104–115. doi: 10.1038/nrg2041. - DOI - PubMed
    1. Misteli T. Beyond the sequence: cellular organization of genome function. Cell. 2007;128:787–800. doi: 10.1016/j.cell.2007.01.028. - DOI - PubMed
    1. Schneider R, Grosschedl R. Dynamics and interplay of nuclear architecture, genome organization, and gene expression. Genes Dev. 2007;21:3027–3043. doi: 10.1101/gad.1604607. - DOI - PubMed
    1. Trinkle-Mulcahy L, Lamond AI. Nuclear functions in space and time: gene expression in a dynamic, constrained environment. FEBS Lett. 2008;582:1960–1970. doi: 10.1016/j.febslet.2008.04.029. - DOI - PubMed
    1. Hajkova P. Epigenetic reprogramming–taking a lesson from the embryo. Curr Opin Cell Biol. 2010;22:342–350. doi: 10.1016/j.ceb.2010.04.011. - DOI - PubMed

Publication types

MeSH terms

LinkOut - more resources