

Construction of a two-parameter empirical model of left ventricle wall motion using cardiac tagged magnetic resonance imaging data
- PMID: 23095713
- PMCID: PMC3511175
- DOI: 10.1186/1475-925X-11-79
Construction of a two-parameter empirical model of left ventricle wall motion using cardiac tagged magnetic resonance imaging data
Abstract
Background: A one-parameter model was previously proposed to characterize the short axis motion of the LV wall at the mid-ventricle level. The single parameter of this model was associated with the radial contraction of myocardium, but more comprehensive model was needed to account for the rotation at the apex and base levels. The current study developed such model and demonstrated its merits and limitations with examples.
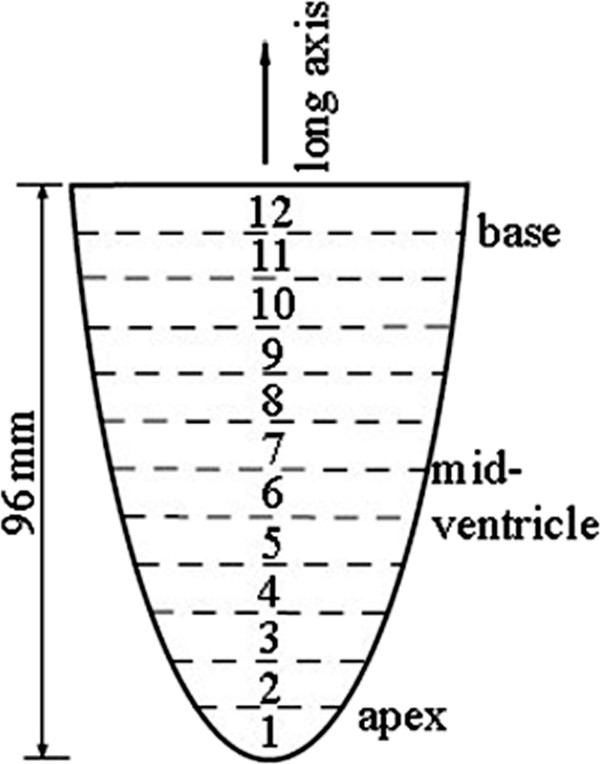
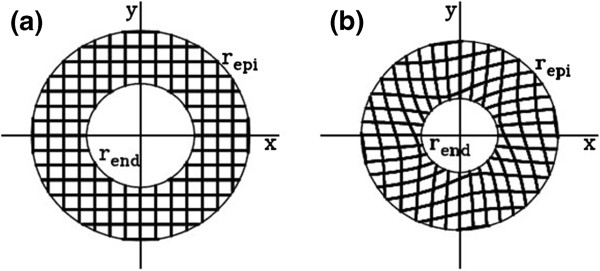
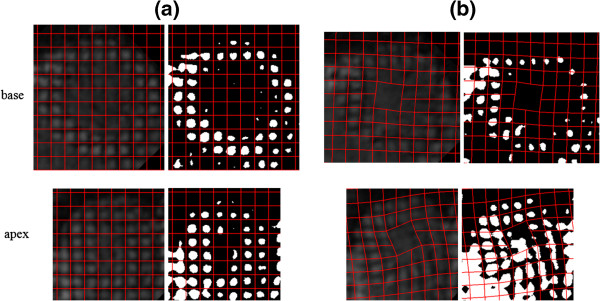
Materials and methods: The hearts of five healthy individuals were visualized using cardiac tagged magnetic resonance imaging (tMRI) covering the contraction and relaxation phases. Based on the characteristics of the overall dynamics of the LV wall, its motion was represented by a combination of two components - radial and rotational. Each component was represented by a transformation matrix with a time-dependent variable α or β.Image preprocessing step and model fitting algorithm were described and applied to estimate the temporal profiles of α and β within a cardiac cycle at the apex, mid-ventricle and base levels. During this process, the tagged lines of the acquired images served as landmark reference for comparing against the model prediction of the motion. Qualitative and quantitative analyses were performed for testing the performance of the model and thus its validation.
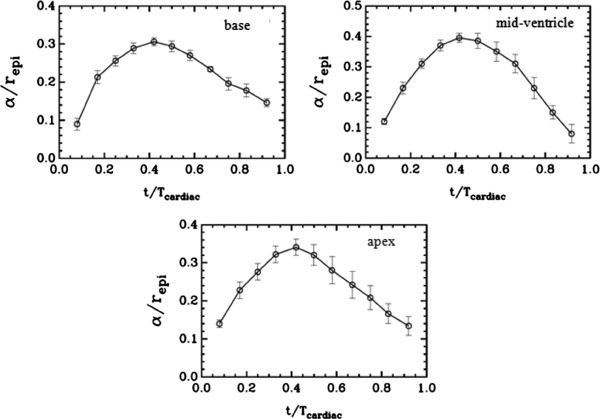
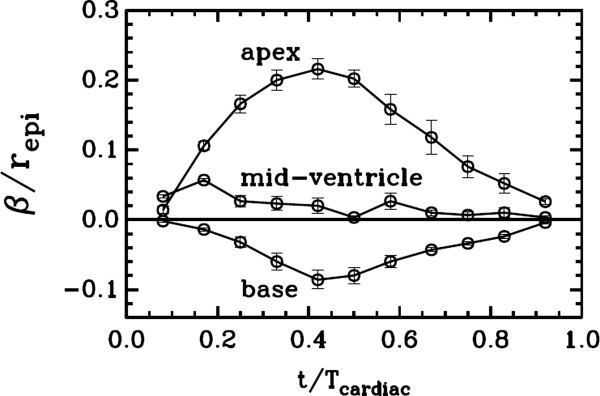
Results: The α and β estimates exhibited similarities in values and temporal trends once they were scaled by the radius of the epicardium (r(epi))and plotted against the time scaled by the period of the cardiac cycle (T(cardiac)) of each heart measured during the data acquisition. α/repi peaked at about Δt/T(cardiac)=0.4 and with values 0.34, 0.4 and 0.3 for the apex, mid-ventricle and base level, respectively. β/r(epi) similarly maximized in amplitude at about Δt/T(cardiac)=0.4, but read 0.2 for the apex and - 0.08 for the base level. The difference indicated that the apex twisted more than the base.
Conclusion: It is feasible to empirically model the spatial and temporal evolution of the LV wall motion using a two-parameter formulation in conjunction with tMRI-based visualization of the LV wall in the transverse planes of the apex, mid-ventricle and base. In healthy hearts, the analytical model will potentially allow deriving biomechanical entities, such as strain, strain rate or torsion, which are typically used as diagnostic, prognostic or predictive markers of cardiovascular diseases including diabetes.
Figures

References
-
- Hashim S, Richens D. Finite element method in cardiac surgery. Interact Cardiovasc Thorac Surg. 2006;5:5–8. - PubMed
-
- Kermani S, Moradi MH, Abrishami-Moghaddam H, Saneei H, Marashi MJ, Shahbazi-Gahrouei D. Quantitative analysis of left ventricular performance from sequences of cardiac magnetic resonance imaging using active mesh model. Comput Med Imaging Graph. 2009;33:222–234. doi: 10.1016/j.compmedimag.2008.12.005. - DOI - PubMed
-
- Moroni D, Colantonio S, Salvetti O, Salvetti M. Heart deformation pattern analysis through shape modelling. Pattern Recognition and Image Analysis. 2009;19:262–270. doi: 10.1134/S1054661809020084. - DOI
Publication types
MeSH terms
Grants and funding
LinkOut - more resources
Full Text Sources
Medical
Miscellaneous
