

Visual outcome correlates with inner macular volume in eyes with surgically closed macular hole
- PMID: 23095727
- PMCID: PMC3636309
- DOI: 10.1097/IAE.0b013e31825c1c0c
Visual outcome correlates with inner macular volume in eyes with surgically closed macular hole
Abstract
Purpose: To determine the macular morphologic features that correlate best with visual outcome in eyes with surgically closed idiopathic macular hole.
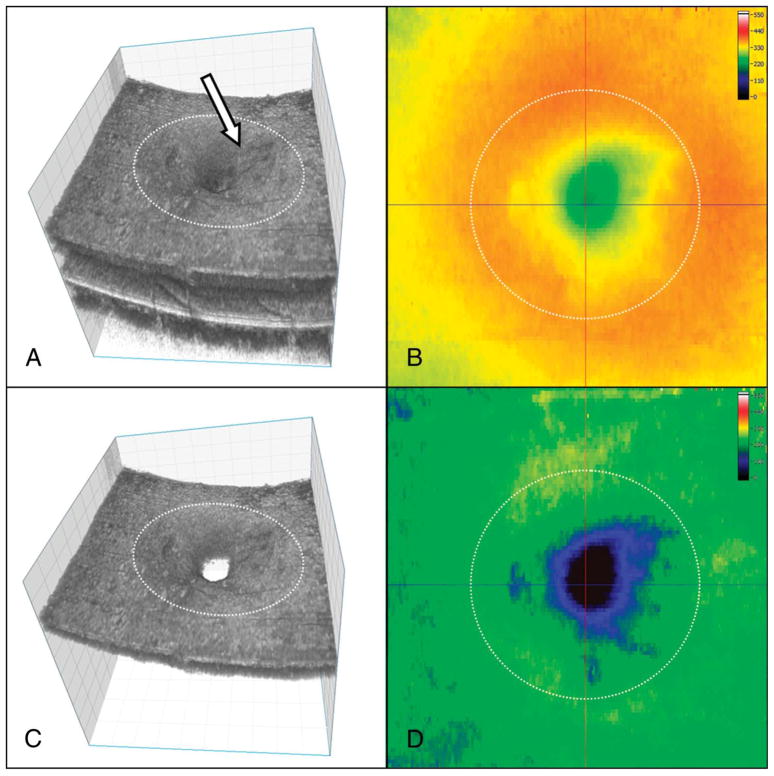
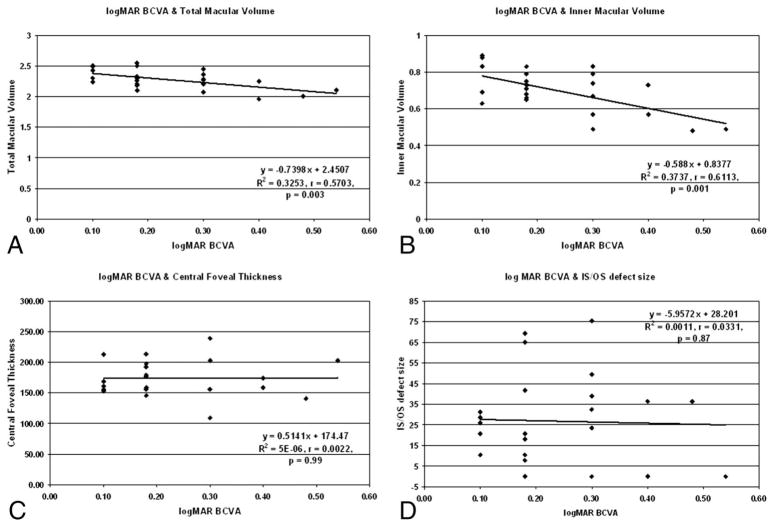
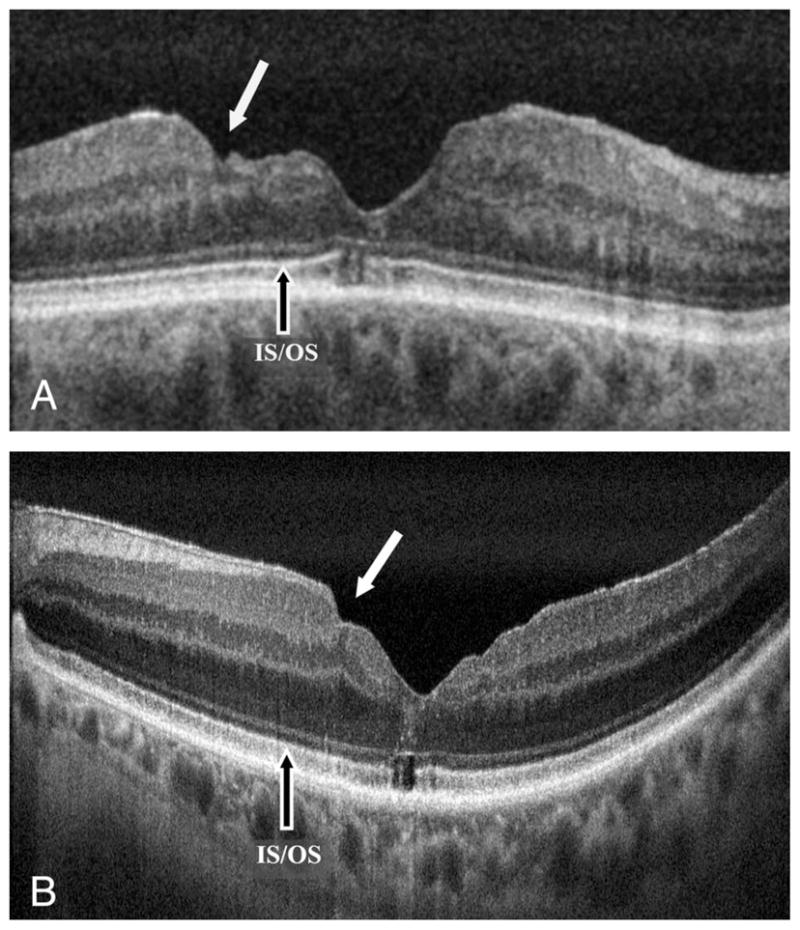
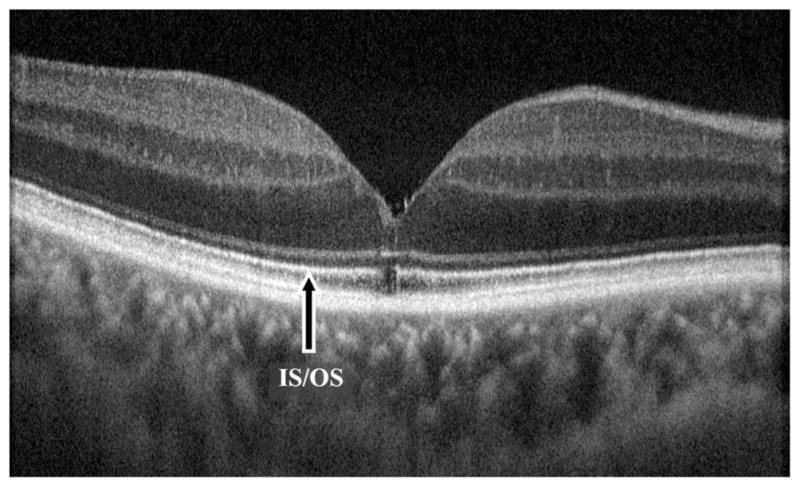
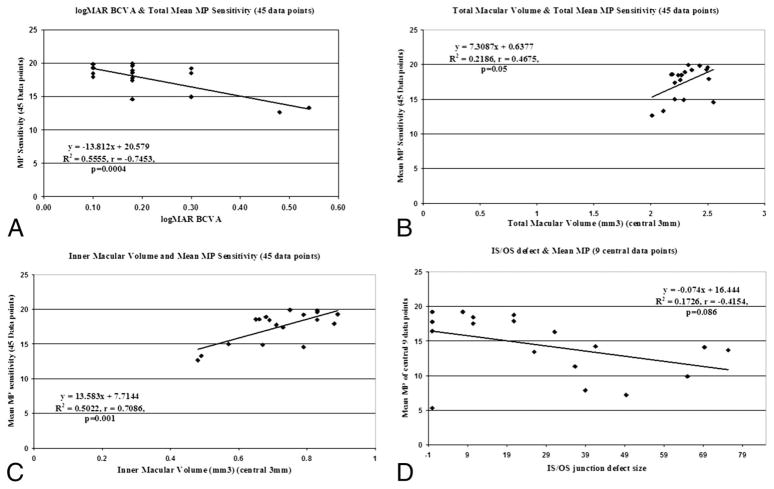
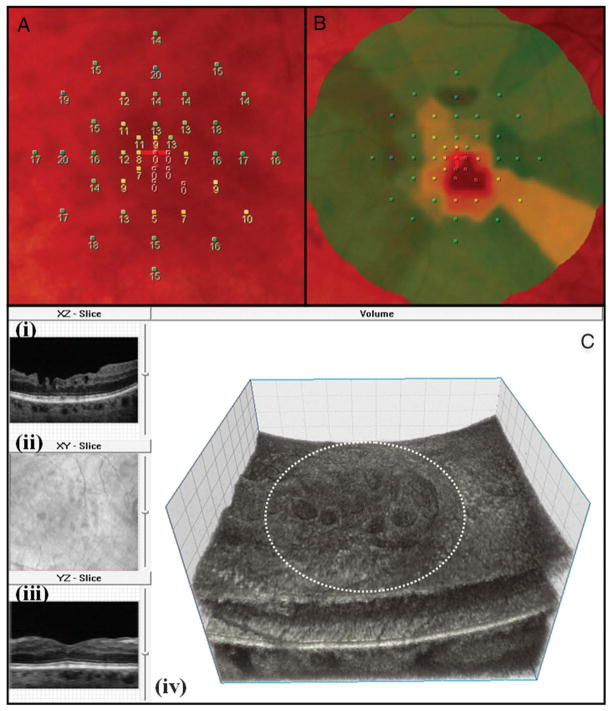
Methods: Transversal observational case series of 24 eyes (22 subjects) imaged postoperatively using high-resolution Fourier domain optical coherence tomography (FD-OCT). Total and inner macular volume for central 3 mm area, central foveal thickness, and size of foveal inner segment-outer segment junction abnormality were correlated with best-corrected visual acuity. Microperimetry (MP-1) test was performed in a subset of 18 eyes.
Results: Mean postoperative best-corrected visual acuity was 20/36 (range, 20/25-20/70). Postoperative follow-up mean was 32.97 ± 24.68 months (range, 5-96 months). Eighteen eyes underwent internal limiting membrane (ILM) peeling. Among FD-OCT parameters, logarithm of the minimum angle of resolution best-corrected visual acuity and mean total microperimetry-1 sensitivity correlated best with inner macular volume in all eyes and ILM-peeled eyes (P < 0.05). Macular surface irregularities were noted in 12 eyes (66.7%) with ILM peeling but in none of the non-ILM-peeled eyes (P = 0.02). No significant correlation was found between microperimetry-1 sensitivity and other FD-OCT parameters.
Conclusion: Because inner macular volume strongly correlated with visual outcome in eyes with surgically closed macular hole, the possible effect of ILM peeling on visual outcome needs to be further investigated.
Conflict of interest statement
The authors declare no conflicts of interest.
Figures
Similar articles
-
Risk factors for development of full-thickness macular holes after pars plana vitrectomy for myopic foveoschisis.Am J Ophthalmol. 2013 Jun;155(6):1021-1027.e1. doi: 10.1016/j.ajo.2013.01.023. Epub 2013 Mar 19. Am J Ophthalmol. 2013. PMID: 23522356
-
Correlation between length of foveal cone outer segment tips line defect and visual acuity after macular hole closure.Ophthalmology. 2012 Jul;119(7):1438-46. doi: 10.1016/j.ophtha.2012.01.023. Epub 2012 Mar 14. Ophthalmology. 2012. PMID: 22424577
-
Efficacy of non-fovea-sparing ILM peeling for symptomatic myopic foveoschisis with and without macular hole.Br J Ophthalmol. 2019 Feb;103(2):257-263. doi: 10.1136/bjophthalmol-2017-311775. Epub 2018 Apr 30. Br J Ophthalmol. 2019. PMID: 29712637
-
Pediatric idiopathic macular hole - A case report and review of literature.Indian J Ophthalmol. 2020 Jan;68(1):241-244. doi: 10.4103/ijo.IJO_354_19. Indian J Ophthalmol. 2020. PMID: 31856539 Free PMC article. Review.
-
FIRST FAILED MACULAR HOLE SURGERY OR REOPENING OF A PREVIOUSLY CLOSED HOLE: Do We Gain by Reoperating?-A Systematic Review and Meta-analysis.Retina. 2020 Jan;40(1):1-15. doi: 10.1097/IAE.0000000000002564. Retina. 2020. PMID: 31335482 Free PMC article.
Cited by
-
Foveola nonpeeling internal limiting membrane surgery to prevent inner retinal damages in early stage 2 idiopathic macula hole.Graefes Arch Clin Exp Ophthalmol. 2014 Oct;252(10):1553-60. doi: 10.1007/s00417-014-2613-7. Epub 2014 Mar 23. Graefes Arch Clin Exp Ophthalmol. 2014. PMID: 24658779
-
Spotlight on the Internal Limiting Membrane Technique for Macular Holes: Current Perspectives.Clin Ophthalmol. 2022 Apr 6;16:1069-1084. doi: 10.2147/OPTH.S284620. eCollection 2022. Clin Ophthalmol. 2022. PMID: 35418741 Free PMC article. Review.
-
Preoperative prognostic factors for macular hole surgery: Which is better?Oman J Ophthalmol. 2019 Jan-Apr;12(1):20-24. doi: 10.4103/ojo.OJO_247_2017. Oman J Ophthalmol. 2019. PMID: 30787530 Free PMC article.
-
Correlation between central retinal thickness after successful macular hole surgery and visual outcome.Jpn J Ophthalmol. 2015 Nov;59(6):394-400. doi: 10.1007/s10384-015-0406-0. Epub 2015 Aug 29. Jpn J Ophthalmol. 2015. PMID: 26314745
-
Re: Unsal et al. Preoperative prognostic factors for macular hole surgery: which is better? Oman J Ophthalmol 2019;12:20-4. [doi: 10.4103/ojo.OJO_247_2017].Oman J Ophthalmol. 2021 Feb 27;14(1):64-65. doi: 10.4103/ojo.OJO_155_2019. eCollection 2021 Jan-Apr. Oman J Ophthalmol. 2021. PMID: 34084041 Free PMC article. No abstract available.
References
-
- Richter-Mueksch S, Sacu S, Osarovsky-Sasin E, et al. Visual performance 3 years after successful macular hole surgery. Br J Ophthalmol. 2009;93:660–663. - PubMed
-
- Imai M, Iijima H, Gotoh T, Tsukahara S. Optical coherence tomography of successfully repaired idiopathic macular holes. Am J Ophthalmol. 1999;128:621–627. - PubMed
-
- Ruiz-Moreno JM, Staicu C, Pinero DP, et al. Optical coherence tomography predictive factors for macular hole surgery outcome. Br J Ophthalmol. 2008;92:640–644. - PubMed
