

Review
doi: 10.1093/neuonc/nos218.
CBTRUS statistical report: primary brain and central nervous system tumors diagnosed in the United States in 2005-2009
- PMID: 23095881
- PMCID: PMC3480240
- DOI: 10.1093/neuonc/nos218
Item in Clipboard
Review
CBTRUS statistical report: primary brain and central nervous system tumors diagnosed in the United States in 2005-2009
Neuro Oncol.
2012 Nov.
Erratum in
- Neuro Oncol. 2013 May;15(5):646-7
No abstract available
Figures
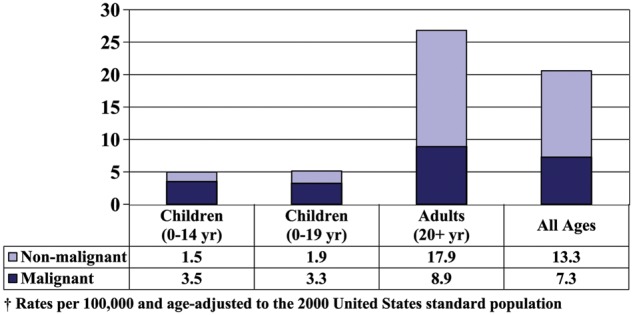
Average Annual Age-Adjusted Incidence Rates† of Primary Brain and CNS Tumors by Age and Behavior.
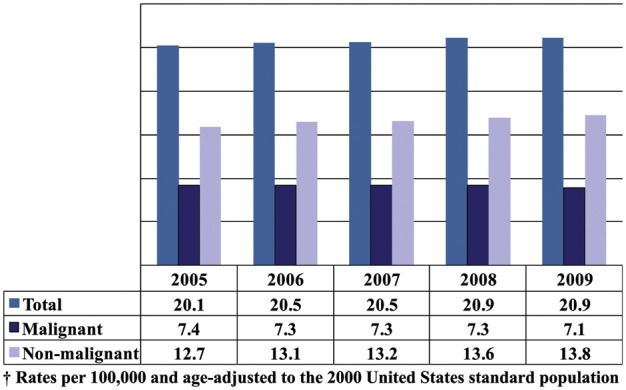
Annual Age-Adjusted Incidence Rates† of Primary Brain and CNS Tumors by Year and Behavior.
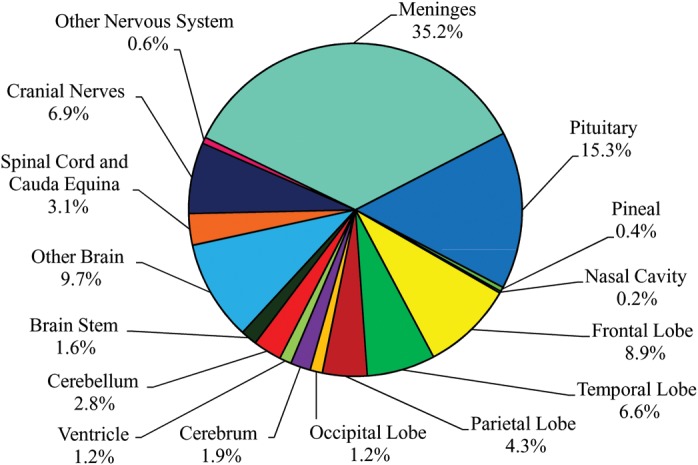
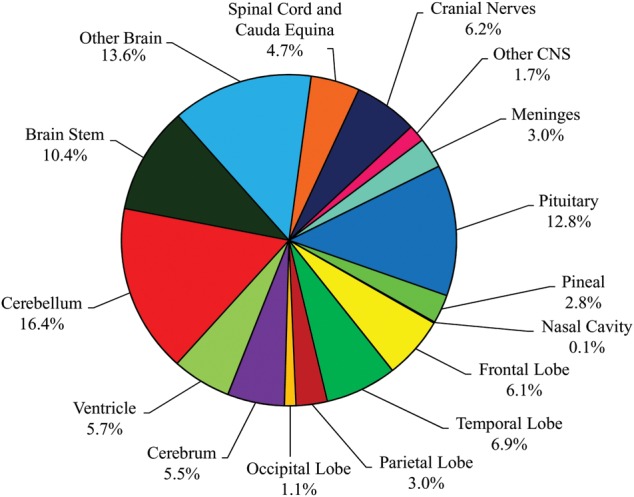
Distribution of Primary Brain and CNS Tumors by Site (N = 311,202).
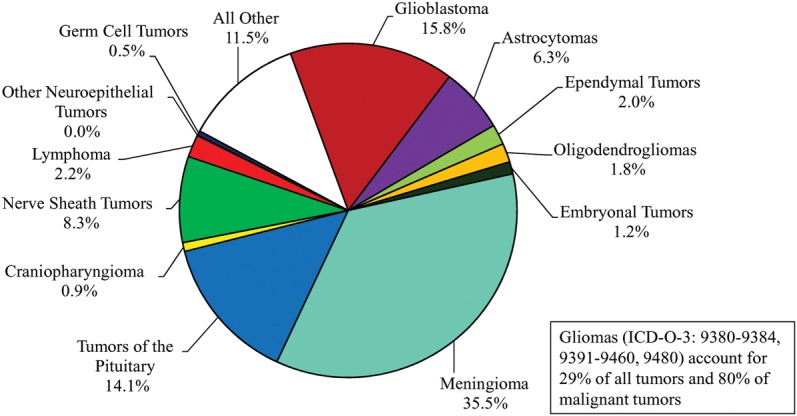
Distribution of Primary Brain and CNS Tumors by Histology (N = 311,202).
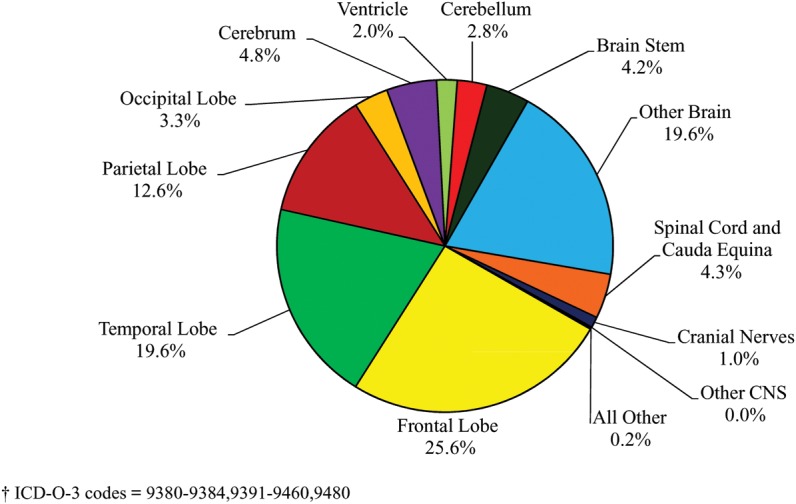
Distribution of Primary Brain and CNS Gliomas† by Site (N = 90,828).
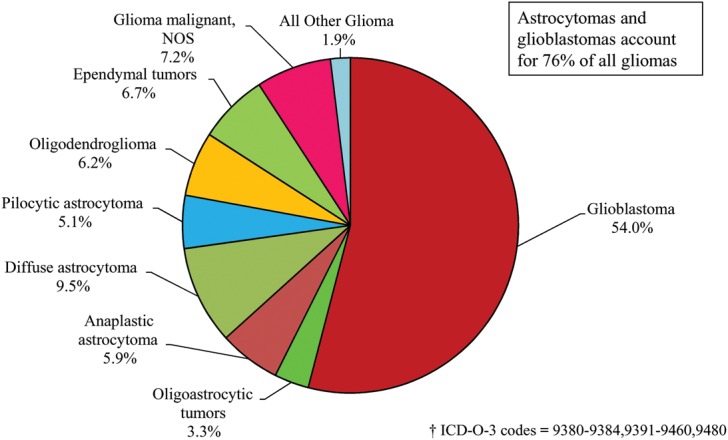
Distribution of Primary Brain and CNS Gliomas† by Histology Subtypes (N = 90,828).
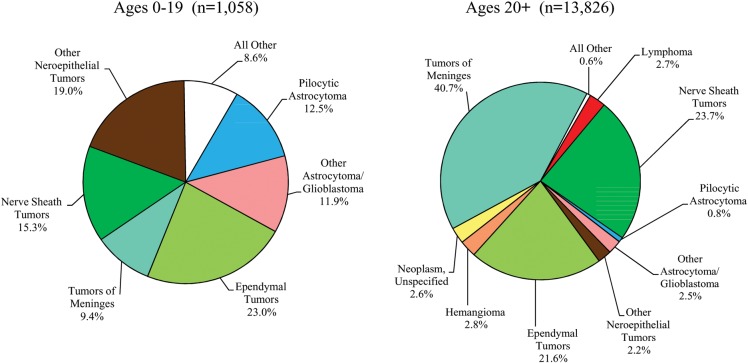
Distribution of Spinal Cord, Spinal Meninges and Cauda Equina Tumors by Age Group and Histology.
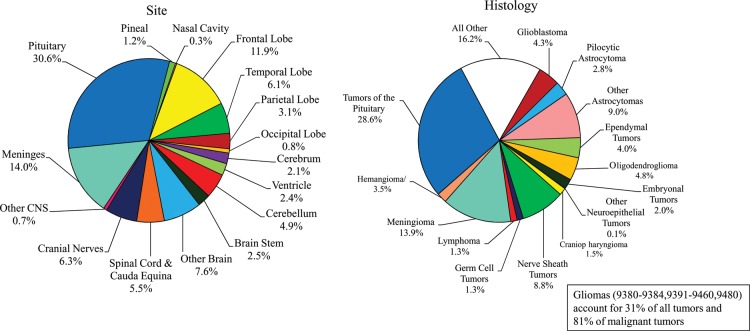
Distribution of Primary Brain and CNS Tumors by Site and Histology in Young Adults (Ages 20-34 years) (N = 26,616)
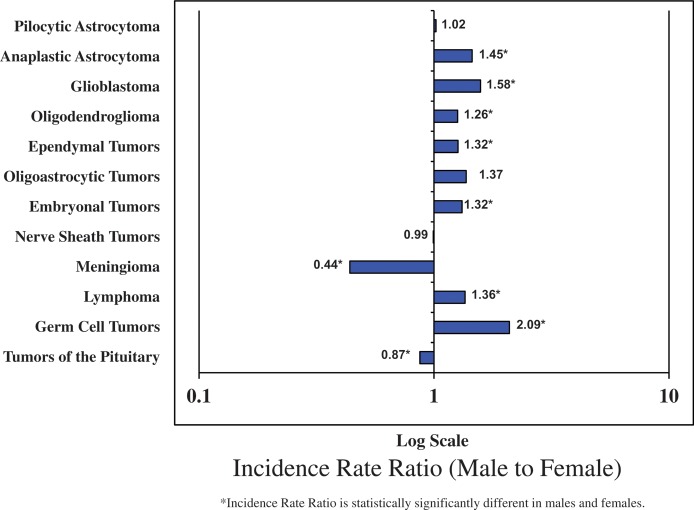
Patterns by Gender for Selected Histologies.
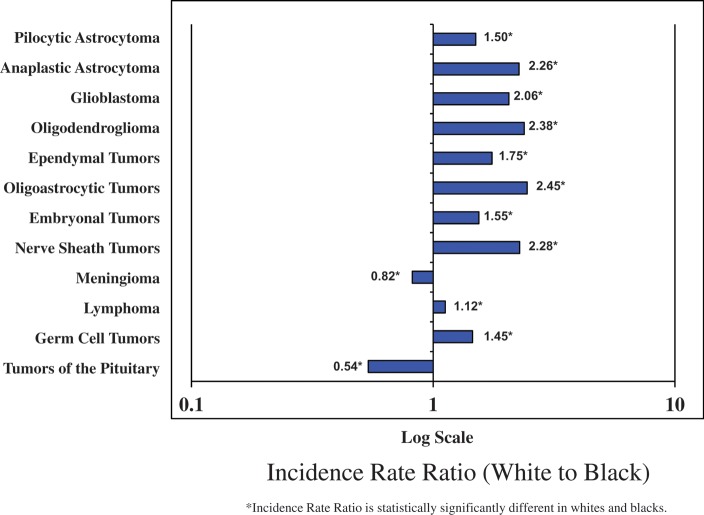
Patterns by Race for Selected Histologies.
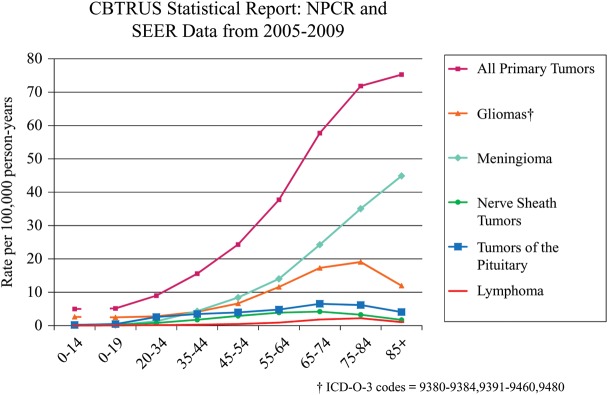
Age-Specific Incidence Rates of Primary Brain and CNS Tumors by Selected Histologies.
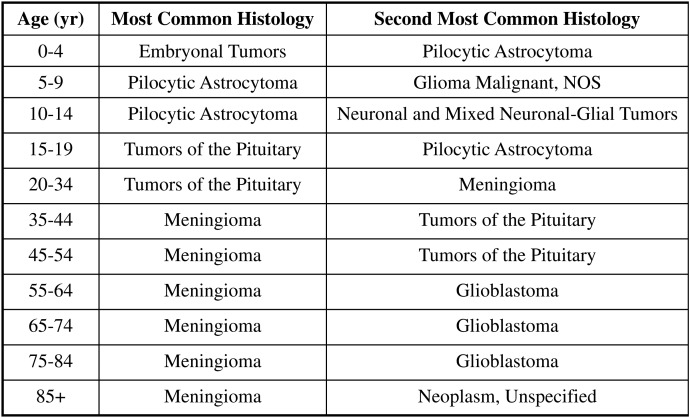
Most Common Primary Brain and CNS Tumors by Age.
Distribution of Childhood (Ages 0-19 years) Primary Brain and CNS Tumors by Site (N = 20,709).
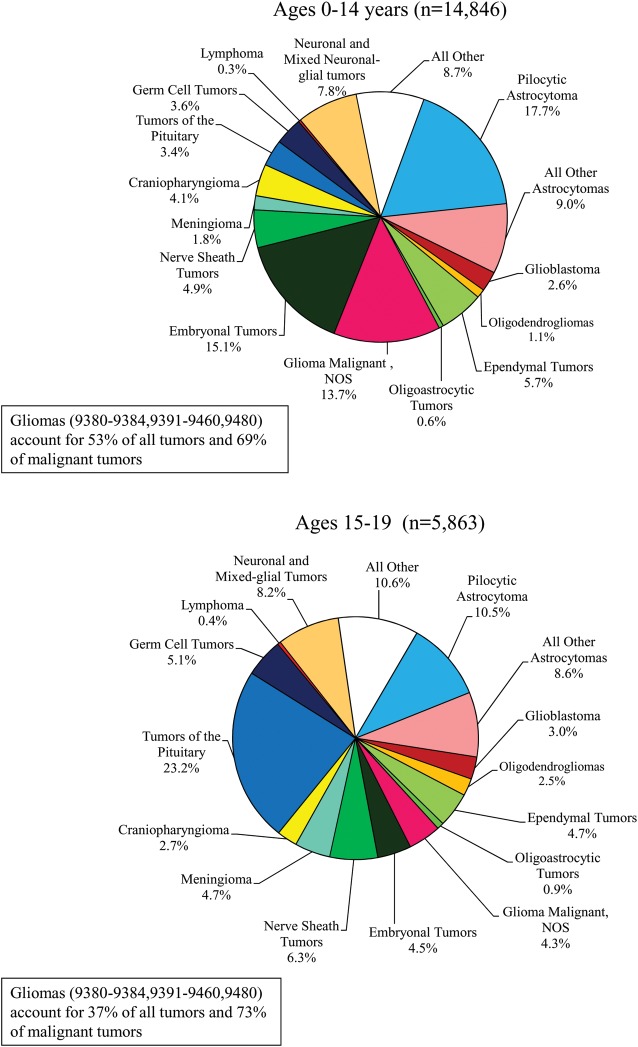
Distribution of Childhood Primary Brain and CNS Tumors by Histology.
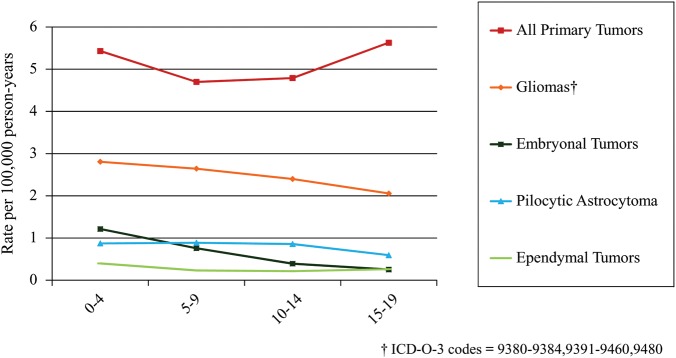
Age-Specific Incidence of Childhood Brain and CNS Tumors by Selected Histologies.
References
Publication types
MeSH terms
LinkOut - more resources
Full Text Sources
Other Literature Sources
Medical
