

The microRNA-26a target E2F7 sustains cell proliferation and inhibits monocytic differentiation of acute myeloid leukemia cells
- PMID: 23096114
- PMCID: PMC3481138
- DOI: 10.1038/cddis.2012.151
The microRNA-26a target E2F7 sustains cell proliferation and inhibits monocytic differentiation of acute myeloid leukemia cells
Abstract
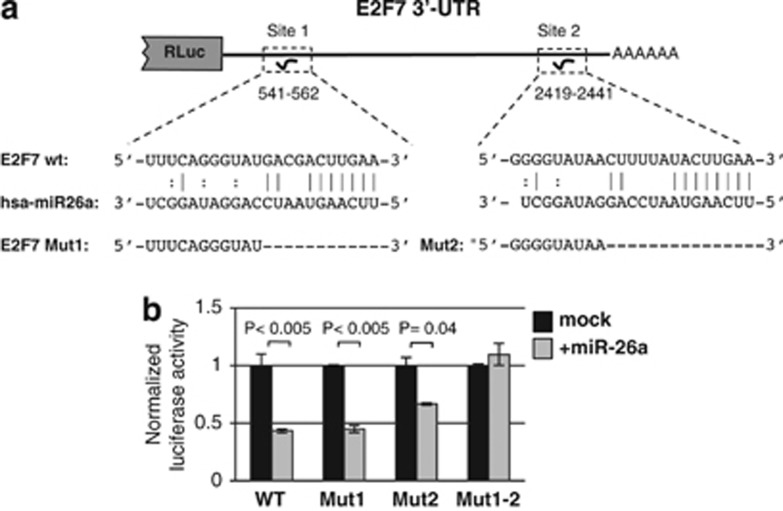
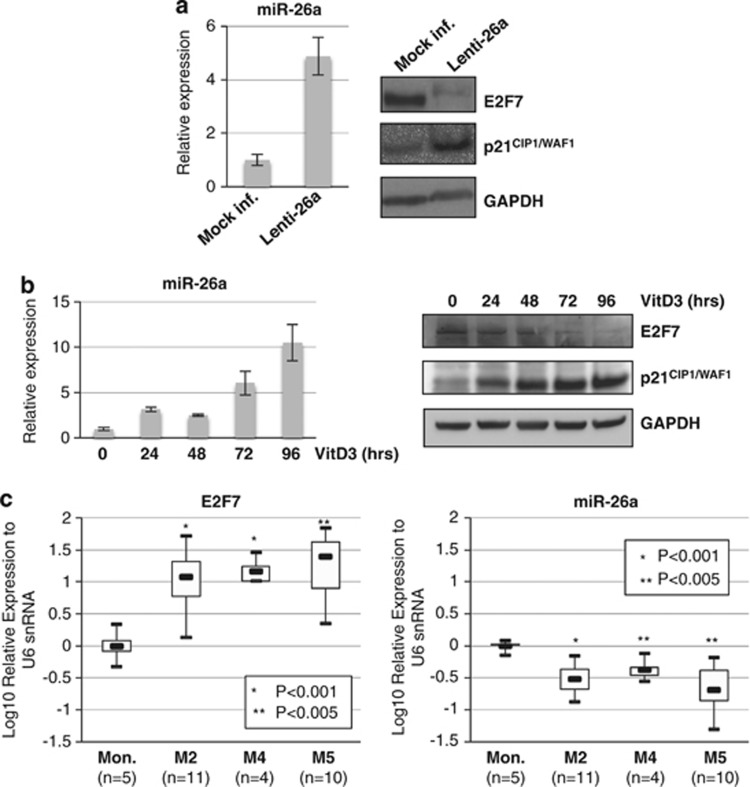
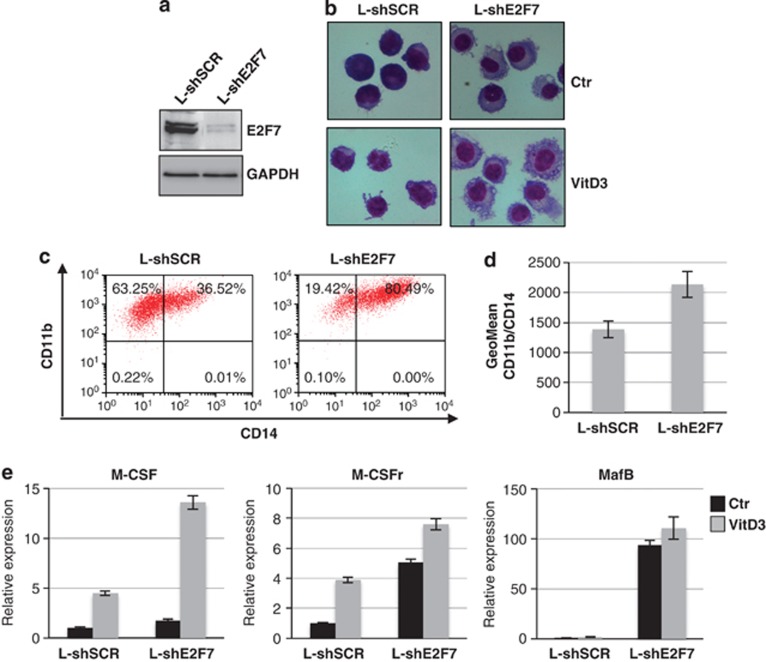
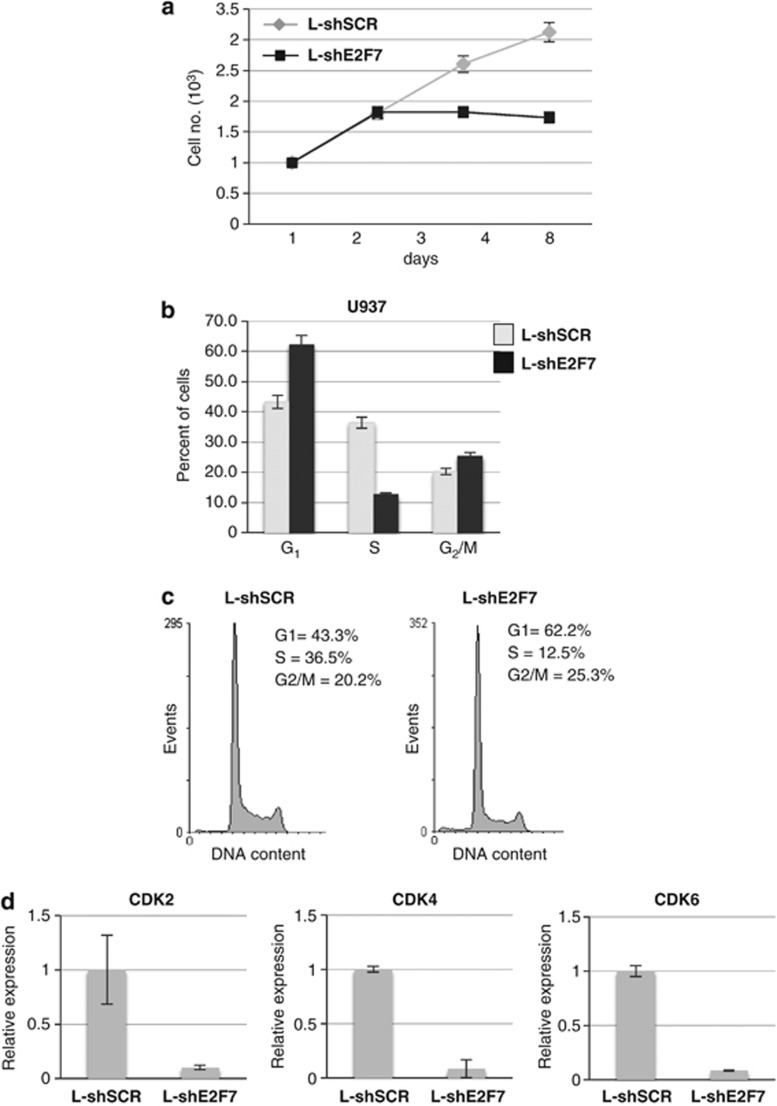
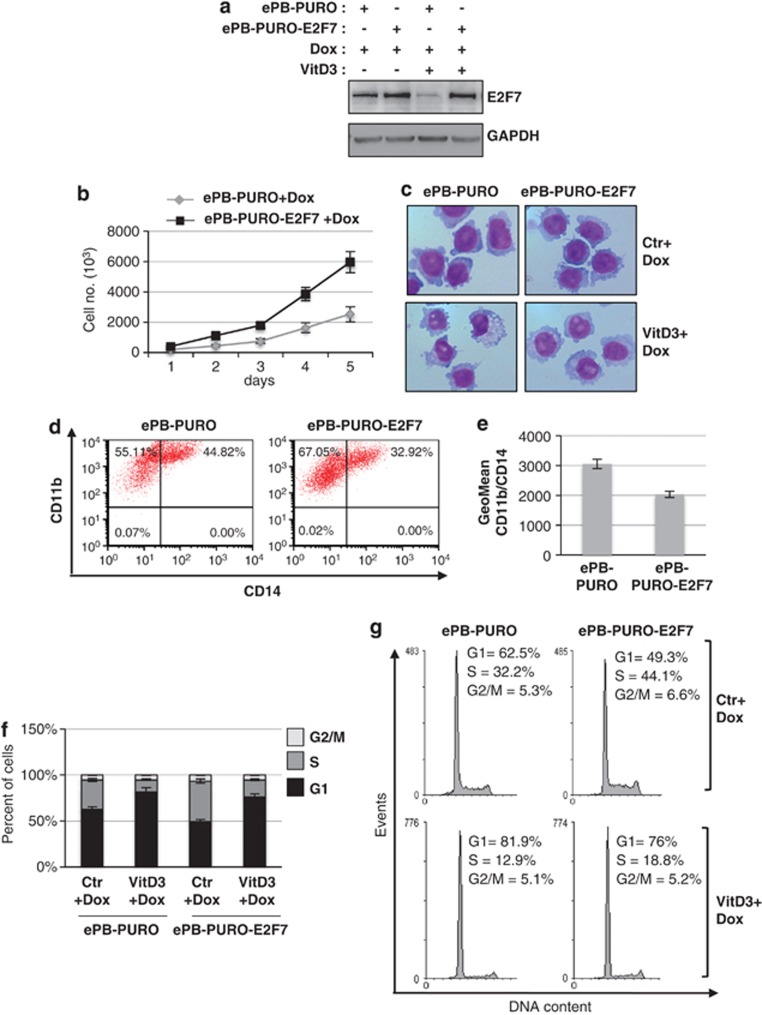
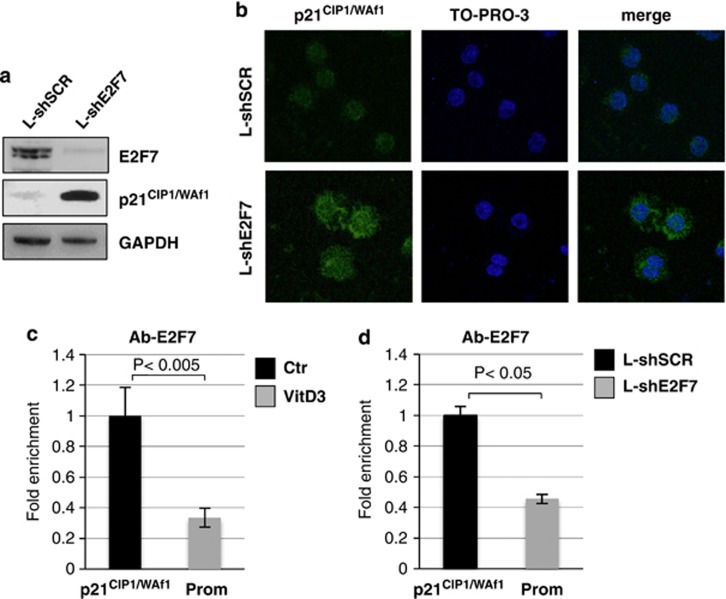
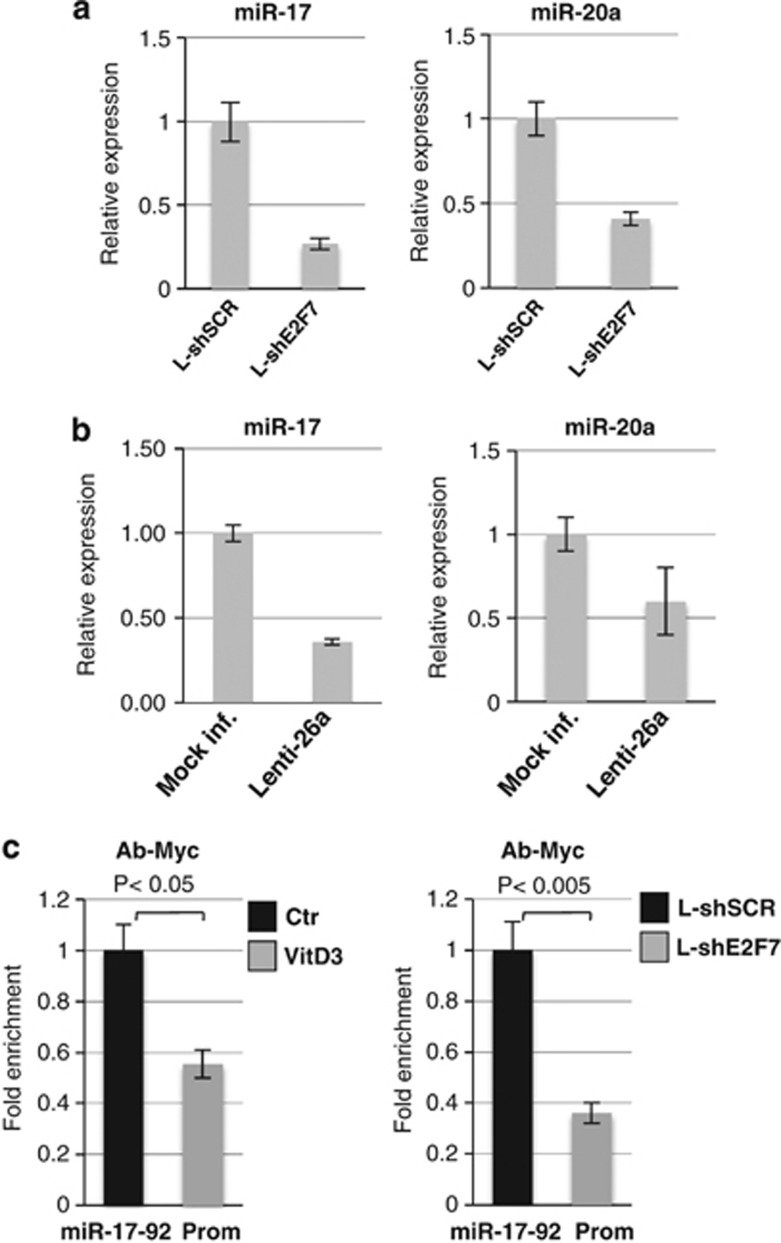
Blocks in genetic programs required for terminal myeloid differentiation and aberrant proliferation characterize acute myeloid leukemia (AML) cells. 1,25-Dihydroxy-vitamin D3 (VitD3) arrests proliferation of AML cells and induces their differentiation into mature monocytes. In a previous study, we showed that miR-26a was induced upon VitD3-mediated monocytic differentiation. Here, we identify E2F7 as a novel target of miR-26a. We show that E2F7 significantly promotes cell cycle progression and inhibits monocytic differentiation of AML cells. We also demonstrate that E2F7 binds the cyclin-dependent kinase inhibitor p21(CIP1/WAF1) (cyclin-dependent kinase inhibitor 1A) promoter repressing its expression. Moreover, interfering with E2F7 expression results in inhibition of c-Myc (v-myc myelocytomatosis viral oncogene homolog) transcriptional activity. This leads to the downregulation of c-Myc transcriptional target miR-17-92 cluster, whose expression has a well-defined role in contributing to block monocytic differentiation and sustain AML cell proliferation. Finally, we show that the expression of E2F7 is upregulated in primary blasts from AML patients. Thus, these findings indicate that the newly identified miR-26a target E2F7 might have an important role in monocytic differentiation and leukemogenesis.
Figures
Similar articles
-
A miR-26a/E2F7 feedback loop contributes to tamoxifen resistance in ER-positive breast cancer.Int J Oncol. 2018 Oct;53(4):1601-1612. doi: 10.3892/ijo.2018.4492. Epub 2018 Jul 19. Int J Oncol. 2018. PMID: 30066905
-
E2F7, regulated by miR‑30c, inhibits apoptosis and promotes cell cycle of prostate cancer cells.Oncol Rep. 2020 Sep;44(3):849-862. doi: 10.3892/or.2020.7659. Epub 2020 Jun 24. Oncol Rep. 2020. PMID: 32582990 Free PMC article.
-
The miR-223 host non-coding transcript linc-223 induces IRF4 expression in acute myeloid leukemia by acting as a competing endogenous RNA.Oncotarget. 2016 Sep 13;7(37):60155-60168. doi: 10.18632/oncotarget.11165. Oncotarget. 2016. PMID: 27517498 Free PMC article.
-
Regulation of the MIR155 host gene in physiological and pathological processes.Gene. 2013 Dec 10;532(1):1-12. doi: 10.1016/j.gene.2012.12.009. Epub 2012 Dec 14. Gene. 2013. PMID: 23246696 Review.
-
Monocytic Differentiation in Acute Myeloid Leukemia Cells: Diagnostic Criteria, Biological Heterogeneity, Mitochondrial Metabolism, Resistance to and Induction by Targeted Therapies.Int J Mol Sci. 2024 Jun 8;25(12):6356. doi: 10.3390/ijms25126356. Int J Mol Sci. 2024. PMID: 38928061 Free PMC article. Review.
Cited by
-
METTL3 regulates WTAP protein homeostasis.Cell Death Dis. 2018 Jul 23;9(8):796. doi: 10.1038/s41419-018-0843-z. Cell Death Dis. 2018. PMID: 30038300 Free PMC article.
-
Integrated Bioinformatics Analysis of Master Regulators in Anaplastic Thyroid Carcinoma.Biomed Res Int. 2019 Apr 28;2019:9734576. doi: 10.1155/2019/9734576. eCollection 2019. Biomed Res Int. 2019. PMID: 31183379 Free PMC article.
-
Arsenic responsive microRNAs in vivo and their potential involvement in arsenic-induced oxidative stress.Toxicol Appl Pharmacol. 2015 Mar 15;283(3):198-209. doi: 10.1016/j.taap.2015.01.014. Epub 2015 Jan 24. Toxicol Appl Pharmacol. 2015. PMID: 25625412 Free PMC article.
-
The roles of E2F7 in cancer: Current knowledge and future prospects.Heliyon. 2024 Jul 9;10(14):e34362. doi: 10.1016/j.heliyon.2024.e34362. eCollection 2024 Jul 30. Heliyon. 2024. PMID: 39108857 Free PMC article. Review.
-
Adding pieces to the puzzle of differentiated-to-anaplastic thyroid cancer evolution: the oncogene E2F7.Cell Death Dis. 2023 Feb 10;14(2):99. doi: 10.1038/s41419-023-05603-8. Cell Death Dis. 2023. PMID: 36765037 Free PMC article.
References
-
- Tenen DG. Disruption of differentiation in human cancer: AML shows the way. Nat Rev Cancer. 2003;3:89–101. - PubMed
-
- Manfredini R, Trevisan F, Grande A, Tagliafico E, Montanari M, Lemoli R, et al. Induction of a functional vitamin D receptor in all-trans-retinoic acid-induced monocytic differentiation of M2-type leukemic blast cells. Cancer Res. 1999;59:3803–3811. - PubMed
-
- Wang Q, Harrison JS, Uskokovic M, Kutner A, Studzinski GP. Translational study of vitamin D differentiation therapy of myeloid leukemia: effects of the combination with a p38 MAPK inhibitor and an antioxidant. Leukemia. 2005;19:1812–1817. - PubMed
-
- Tagliafico E, Tenedini E, Manfredini R, Grande A, Ferrari F, Roncaglia E, et al. Identification of a molecular signature predictive of sensitivity to differentiation induction in acute myeloid leukemia. Leukemia. 2006;20:1751–1758. - PubMed
Publication types
MeSH terms
Substances
LinkOut - more resources
Full Text Sources
Medical
