Comparative Study
. 2012;4(11):1189-200.
doi: 10.1093/gbe/evs093.

Sex-biased transcriptome evolution in Drosophila

Affiliations
Comparative Study

Sex-biased transcriptome evolution in Drosophila

Raquel Assis et al. Genome Biol Evol. 2012.

Abstract

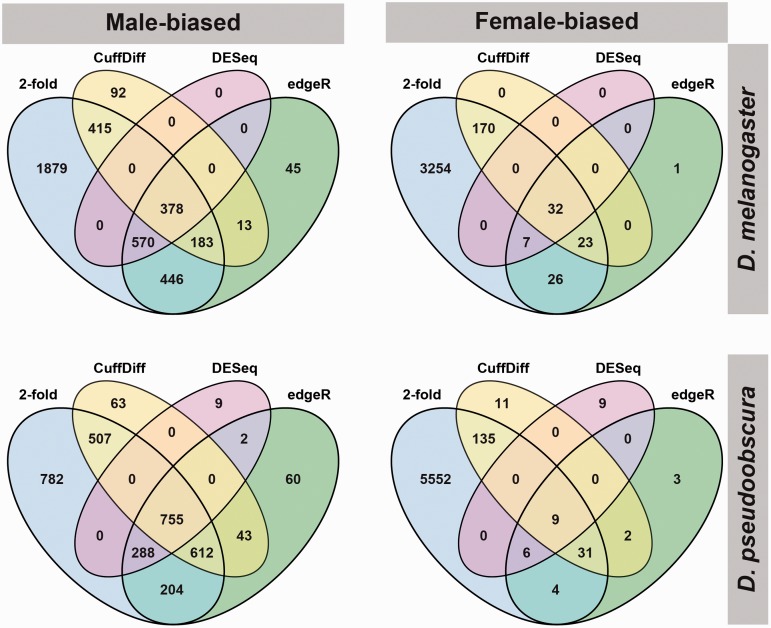
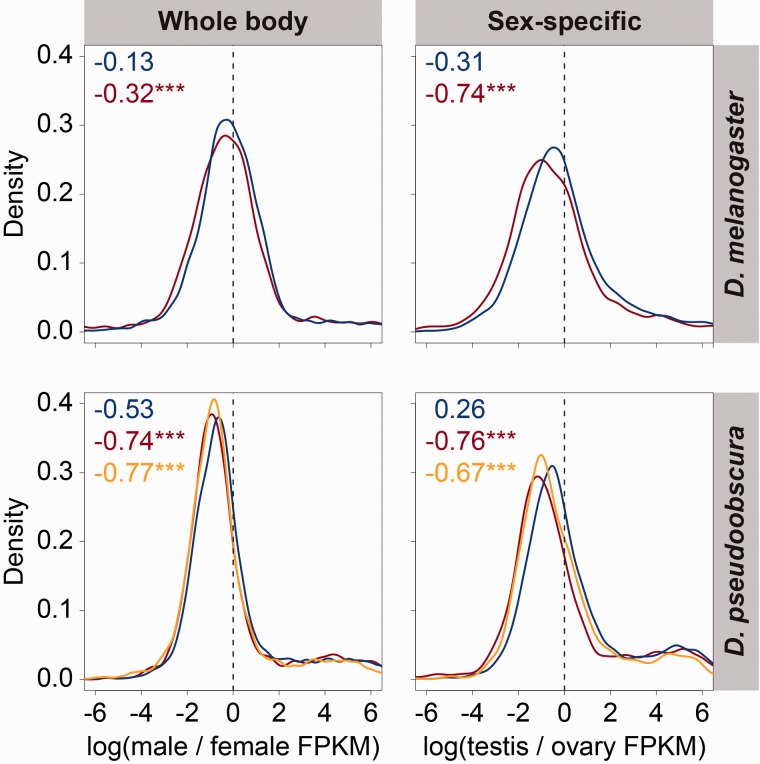
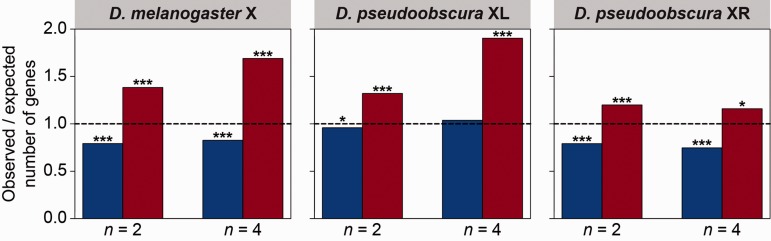
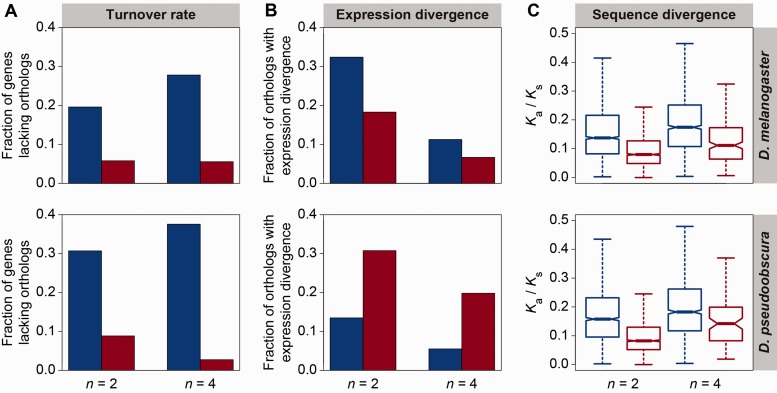
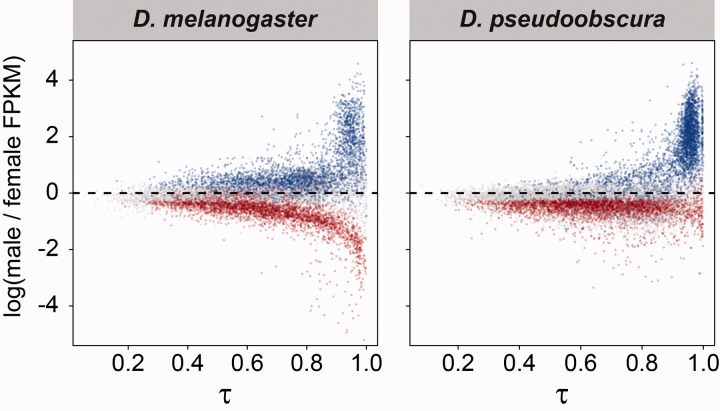
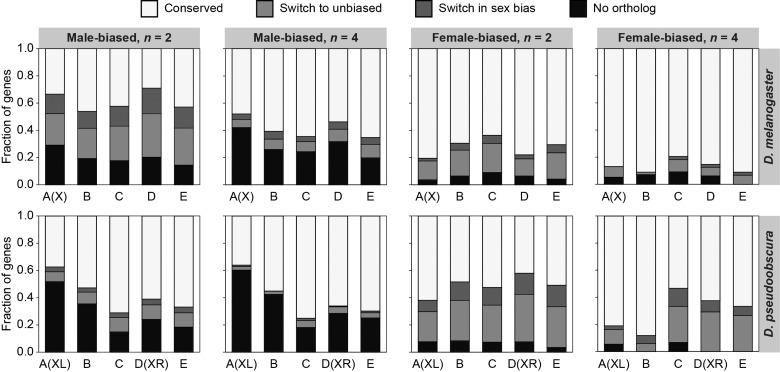
Sex-biased genes are thought to drive phenotypic differences between males and females. The recent availability of high-throughput gene expression data for many related species has led to a burst of investigations into the genomic and evolutionary properties of sex-biased genes. In Drosophila, a number of studies have found that X chromosomes are deficient in male-biased genes (demasculinized) and enriched for female-biased genes (feminized) and that male-biased genes evolve faster than female-biased genes. However, studies have yielded vastly different conclusions regarding the numbers of sex-biased genes and forces shaping their evolution. Here, we use RNA-seq data from multiple tissues of Drosophila melanogaster and D. pseudoobscura, a species with a recently evolved X chromosome, to explore the evolution of sex-biased genes in Drosophila. First, we compare several independent metrics for classifying sex-biased genes and find that the overlap of genes identified by different metrics is small, particularly for female-biased genes. Second, we investigate genome-wide expression patterns and uncover evidence of demasculinization and feminization of both ancestral and new X chromosomes, demonstrating that gene content on sex chromosomes evolves rapidly. Third, we examine the evolutionary rates of sex-biased genes and show that male-biased genes evolve much faster than female-biased genes, which evolve at similar rates to unbiased genes. Analysis of gene expression among tissues reveals that this trend may be partially due to pleiotropic effects of female-biased genes, which limits their evolutionary potential. Thus, our findings illustrate the importance of accurately identifying sex-biased genes and provide insight into their evolutionary dynamics in Drosophila.


Figures

F<sc>ig</sc>. 1.—
Fig. 1.—
Comparison of four metrics for classifying sex-biased genes. Venn diagrams of numbers of male-biased (left) and female-biased (right) genes identified by four comparisons of whole male and whole female tissues in D. melanogaster (top) and D. pseudoobscura (bottom).
F<sc>ig</sc>. 2.—
Fig. 2.—
Relationship between n and sex-biased gene expression. Plots show correlations between the number of metrics (n) that identify genes as male biased (blue) or female biased (red) and the whole male/whole female expression ratios of those genes in D. melanogaster (left) and D. pseudoobscura (right).
F<sc>ig</sc>. 3.—
Fig. 3.—
Absolute expression on X chromosomes and autosomes in different tissues. Density plots of absolute expression for X chromosomes and autosomes in different tissue of D. melanogaster (top) and D. pseudoobscura (bottom). Each panel corresponds to a different tissue, with autosomal densities depicted in blue, ancestral X chromosome (D. melanogaster X and D. pseudoobscura XL) densities depicted in red, and D. pseudoobscura XR densities depicted in orange. Medians are given in the top left corner of each panel, with asterisks corresponding to P < 0.05 (*), P < 0.01 (**), and P < 0.001 (***).
F<sc>ig</sc>. 4.—
Fig. 4.—
Contributions of sex-specific tissue expression on X chromosomes and autosomes. Density plots of sex-specific tissue/whole body expression in D. melanogaster (top) and D. pseudoobscura (bottom). Each panel corresponds to a different sex-specific tissue, with autosomal densities depicted in blue, ancestral X chromosome (D. melanogaster X and D. pseudoobscura XL) densities depicted in red, and D. pseudoobscura XR densities depicted in orange. Medians are given in the top left corner of each panel, with asterisks corresponding to P < 0.05 (*), P < 0.01 (**), and P < 0.001 (***).
F<sc>ig</sc>. 5.—
Fig. 5.—
Sex-biased expression on X chromosomes and autosomes. Density plots of whole male/whole female (left) and testis/ovary (right) expression ratios in D. melanogaster (top) and D. pseudoobscura (bottom). Autosomal densities are depicted in blue, ancestral X chromosome (D. melanogaster X and D. pseudoobscura XL) densities are depicted in red, and D. pseudoobscura XR densities are depicted in orange. Vertical dashed lines indicate equal male and female expression. Medians are given in the top left corner of each panel, with asterisks corresponding to P < 0.05 (*), P < 0.01 (**), and P < 0.001 (***).
F<sc>ig</sc>. 6.—
Fig. 6.—
Representation of sex-biased genes on Drosophila X chromosomes. Proportions of observed/expected numbers of male-biased (blue) and female-biased (red) genes on D. melanogaster X, D. pseudoobscura XL, and D. pseudoobscura XR. The number of metrics (n) used in the classification of sex-biased genes for each analysis is indicated on the x axis. Horizontal dashed lines indicate equal observed and expected numbers of genes, and asterisks indicate P < 0.05 (*), P < 0.01 (**), and P < 0.001 (***).
F<sc>ig</sc>. 7.—
Fig. 7.—
Evolution of sex-biased genes in Drosophila. Rates of D. melanogaster (top) and D. pseudoobscura (bottom) male-biased (blue) and female-biased (red) gene turnover (A), expression divergence (B), and sequence divergence (C). The number of metrics (n) used in the classification of sex-biased genes for each analysis is indicated on the x axis.
F<sc>ig</sc>. 8.—
Fig. 8.—
Tissue specificity of sex-biased genes. Correlations between whole male/whole female expression ratios and τ in D. melanogaster (left) and D. pseudoobscura (right). Unbiased genes are represented by gray dots, male-biased genes by blue dots, and female-biased genes by red dots (n = 2). Horizontal dashed lines indicate equal male and female expression.
F<sc>ig</sc>. 9.—
Fig. 9.—
Turnover and expression evolution of sex-biased genes among chromosomes. Proportions of male- and female-biased genes on each Muller element of D. melanogaster (top) and D. pseudoobscura (bottom) that, in the other species, have conserved expression, are unbiased, have opposite sex-biased expression, or do not have orthologs.

Similar articles

Cited by

References

    1. Altschul SF, Gish W, Miller W, Myers EW, Lipman DJ. Basic local alignment search tool. J Mol Biol. 1990;5:403–410. - PubMed
    1. Anders S. Analyzing RNA-Seq data with the “DESeq” package. Mol Biol. 2010;43:1–17.
    1. Bachtrog D, Toda NRT, Lockton S. Dosage compensation and demasculinization of X chromosomes in Drosophila. Curr Biol. 2010;20:1476–1481. - PMC - PubMed
    1. Beckenbach AT, Wei YW, Liu H. Relationships in the Drosophila obscura species group, inferred from mitochondrial cytochrome oxidase II sequences. Mol Biol Evol. 1993;10:619–634. - PubMed
    1. Connallon T, Knowles L. Intergenomic conflict revealed by patterns of sex-biased gene expression. Trends Genet. 2005;21:495–499. - PubMed

Publication types

LinkOut - more resources