. 2012 Dec;18(12):2335-44.
doi: 10.1261/rna.035907.112. Epub 2012 Oct 24.

RNA-ID, a highly sensitive and robust method to identify cis-regulatory sequences using superfolder GFP and a fluorescence-based assay

Affiliations

RNA-ID, a highly sensitive and robust method to identify cis-regulatory sequences using superfolder GFP and a fluorescence-based assay

Kimberly M Dean et al. RNA. 2012 Dec.

Abstract

We have developed a robust and sensitive method, called RNA-ID, to screen for cis-regulatory sequences in RNA using fluorescence-activated cell sorting (FACS) of yeast cells bearing a reporter in which expression of both superfolder green fluorescent protein (GFP) and yeast codon-optimized mCherry red fluorescent protein (RFP) is driven by the bidirectional GAL1,10 promoter. This method recapitulates previously reported progressive inhibition of translation mediated by increasing numbers of CGA codon pairs, and restoration of expression by introduction of a tRNA with an anticodon that base pairs exactly with the CGA codon. This method also reproduces effects of paromomycin and context on stop codon read-through. Five key features of this method contribute to its effectiveness as a selection for regulatory sequences: The system exhibits greater than a 250-fold dynamic range, a quantitative and dose-dependent response to known inhibitory sequences, exquisite resolution that allows nearly complete physical separation of distinct populations, and a reproducible signal between different cells transformed with the identical reporter, all of which are coupled with simple methods involving ligation-independent cloning, to create large libraries. Moreover, we provide evidence that there are sequences within a 9-nt library that cause reduced GFP fluorescence, suggesting that there are novel cis-regulatory sequences to be found even in this short sequence space. This method is widely applicable to the study of both RNA-mediated and codon-mediated effects on expression.


Figures
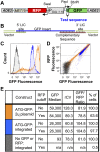
FIGURE 1.
FIGURE 1.
Design and function of the RNA-ID reporter for RNA cis-regulatory elements. (A) Diagram of the dual GFP and RFP vector. Expression of superfolder GFP (Pedelacq et al. 2006) and yeast-optimized mCherry RFP (Keppler-Ross et al. 2008) are under the control of the bidirectional, galactose-inducible promoter GAL1,10. The MET15 gene is used for selection in yeast, and integration is directed to the ADE2 locus. (B) Schematic illustrating LIC cloning into the sites upstream of GFP. Single-stranded sequences on the 5′ and 3′ ends of the vector pEKD1024 (green lines) are created by digestion of the vector with restriction endonucleases PacI and BbrPI, followed by treatment with T4 DNA polymerase in the presence of dGTP to generate 17 and 12 base single-stranded ends. Two overlapping oligonucleotides with homology with the single-stranded vector ends suffice for cloning, and allow use of a single oligonucleotide containing a randomized sequence at a defined position without requiring a full-length base-paired complement. The top oligonucleotide (blue line) contains a sequence complementary to the 5′ LIC site, the sequence of interest, including the ATG, and a 12-base sequence complementary to the bottom oligonucleotide. The bottom oligonucleotide (brown line) minimally contains a sequence that is complementary to the 3′ LIC site sequence, followed by a sequence that base pairs with the indicated complementary sequence of the top oligonucleotide. Sequences can also be inserted near the 5′ end of the RFP gene after digestion with the restriction endonuclease SwaI and resection with T4 DNA polymerase to create different single-stranded ends (see Materials and Methods). (C,D) Comparison of fluorescence outputs from a reporter on a multicopy plasmid versus an integrated reporter. To express GFP, an in-frame ATG is inserted upstream of GFP, as described above. (C) Histogram of GFP fluorescence profile versus cell number from yeast cells bearing the GFP and RFP genes on a 2μ plasmid (orange), the identical GFP/RFP construct integrated at the ade2 locus (blue), and an integrated plasmid lacking the GFP and RFP genes (gray). (D) Scatter plot of cells expressing GFP and RFP. Cells and the colors are identical to those in C. (E) Comparison of the signal and noise, with or without the RFP cutoff, from multicopy versus integrated GFP constructs.
FIGURE 2.
FIGURE 2.
Translation regulation by arg CGA codon pairs is recapitulated with RNA-ID. (A,B) Insertion of increasing numbers of inhibitory CGA codons into the RNA-ID reporter results in progressively reduced GFP/RFP fluorescence. (A) Scatter plot of GFP fluorescence versus RFP fluorescence of yeast cells with constructs bearing the indicated sequences inserted in GFP. ((AGA)3-GFP, teal; (CGA)2-GFP, red; (CGA)3-GFP, orange; (CGA)4-GFP, purple; no ATG –GFP, brown). (B) Comparison of the median GFP/RFP value and the percentage of cells in each gate for each construct. The values reported (and the standard deviation) are the average of the median value obtained for each of four independent transformants. (C,D) Inhibition of translation by CGA codons is substantially suppressed by coexpression of a mutant tRNAArg(UCG)* that base pairs with CGA. (C) A bar graph of the GFP/RFP median of cells bearing integrated GFP constructs, and 2μ plasmids that express no tRNA (vector), tRNAArg(ICG), the mutant tRNAArg(UCG)*, or tRNAArg(UCU). (D) Quantification of expression of data in C. Each value is the average of the median values obtained for four independent transformants with each plasmid. The tRNAArg species are indicated by their anticodons in the legend and table.
FIGURE 3.
FIGURE 3.
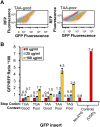
Paromomycin- and context-dependent stop codon read-through is recapitulated using the reporter for RNA cis-regulatory elements. (A) Effects of paromomycin on GFP fluorescence of strains with the TAA stop codon in good or poor contexts. Stop codons are flanked by sequences previously reported to cause low read-through (good context) or high read-through (poor context) (Bonetti et al. 1995). Scatter plots of GFP versus RFP fluorescence are shown in each set for a single strain grown in 0 μg/mL (red), 25 μg/mL (blue), and 100 μg/mL (orange) paromomycin. Strains on the left contain the insertion CAA-TAA-GCA beginning at codon 6 of GFP (good context), while strains on the right contain the sequence CAA-TAA-CAA at the same position (poor context). (B) Effects of paromomycin on median GFP/RFP levels from GFP constructs bearing stop codons in different sequence contexts. In the poor context, each stop codon is flanked by CAA on both its 5′ and 3′ side, while in the good context for TGA, the sequence is CAA-TGA-GAC, and for TAA, it is CAA-TAA-GCA. GFP/RFP medians were determined for four independent transformants of each construct at each concentration of paromomycin.
FIGURE 4.
FIGURE 4.
Libraries of three randomized codon inserts at residue 6 of GFP results in a fraction of cells with reduced GFP expression. (A) Scatter plot from FACS of 500,000 yeast cells bearing a library of three randomized codons, (NNN)3, inserted into GFP at residues 6–8. (B) Scatter plot from FACS of 500,000 yeast cells bearing a library of three semi-randomized codons, (VNN)3, inserted into GFP at residues 6–8. V is A, G, or C. (C) Quantification of the fraction of the total population of each library that migrates in each gate. (D,E) Yeast strains that migrate into Gate 3, the low-expression gate, are strongly enriched for strains that exhibit low expression when regrown. (D) Scatter plot of GFP versus RFP fluorescence of cells from the (VNN)3 library that migrated in Gate 3 in B, and were then regrown and re-examined by flow cytometry. (E) Quantification of the fraction of cells regrown from Gate 3 that migrate into each gate when reanalyzed.

Similar articles

Cited by

References

    1. Alexandrov A, Vignali M, LaCount DJ, Quartley E, de Vries C, De Rosa D, Babulski J, Mitchell SF, Schoenfeld LW, Fields S, et al. 2004. A facile method for high-throughput co-expression of protein pairs. Mol Cell Proteomics 3: 934–938 - PubMed
    1. Aslanidis C, de Jong PJ 1990. Ligation-independent cloning of PCR products (LIC-PCR). Nucleic Acids Res 18: 6069–6074 - PMC - PubMed
    1. Barrera LO, Ren B 2006. The transcriptional regulatory code of eukaryotic cells—insights from genome-wide analysis of chromatin organization and transcription factor binding. Curr Opin Cell Biol 18: 291–298 - PubMed
    1. Bartel DP 2009. MicroRNAs: Target recognition and regulatory functions. Cell 136: 215–233 - PMC - PubMed
    1. Bonetti B, Fu L, Moon J, Bedwell DM 1995. The efficiency of translation termination is determined by a synergistic interplay between upstream and downstream sequences in Saccharomyces cerevisiae. J Mol Biol 251: 334–345 - PubMed

Publication types

LinkOut - more resources