. 2013 Jan;87(1):597-610.
doi: 10.1128/JVI.00714-12. Epub 2012 Oct 24.

Influenza A viruses grow in human pancreatic cells and cause pancreatitis and diabetes in an animal model

Affiliations

Influenza A viruses grow in human pancreatic cells and cause pancreatitis and diabetes in an animal model

Ilaria Capua et al. J Virol. 2013 Jan.

Abstract

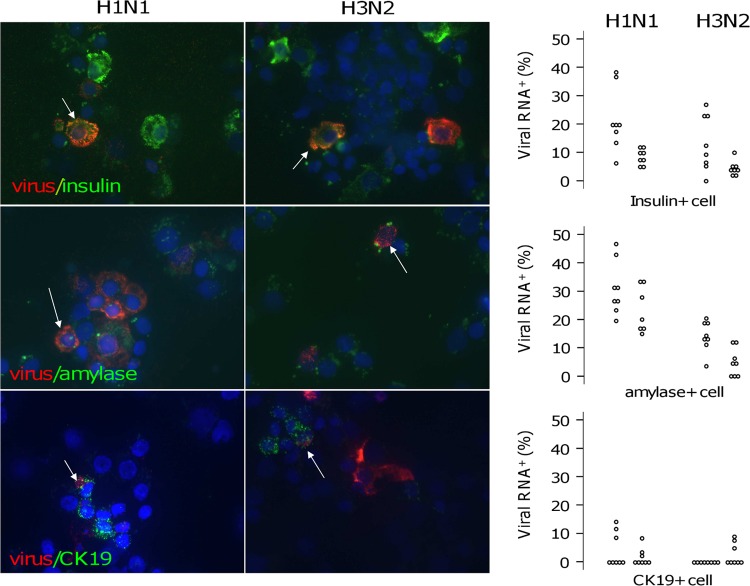
Influenza A viruses commonly cause pancreatitis in naturally and experimentally infected animals. In this study, we report the results of in vivo investigations carried out to establish whether influenza virus infection could cause metabolic disorders linked to pancreatic infection. In addition, in vitro tests in human pancreatic islets and in human pancreatic cell lines were performed to evaluate viral growth and cell damage. Infection of an avian model with two low-pathogenicity avian influenza isolates caused pancreatic damage resulting in hyperlipasemia in over 50% of subjects, which evolved into hyperglycemia and subsequently diabetes. Histopathology of the pancreas showed signs of an acute infection resulting in severe fibrosis and disruption of the structure of the organ. Influenza virus nucleoprotein was detected by immunohistochemistry (IHC) in the acinar tissue. Human seasonal H1N1 and H3N2 viruses and avian H7N1 and H7N3 influenza virus isolates were able to infect a selection of human pancreatic cell lines. Human viruses were also shown to be able to infect human pancreatic islets. In situ hybridization assays indicated that viral nucleoprotein could be detected in beta cells. The cytokine activation profile indicated a significant increase of MIG/CXCL9, IP-10/CXCL10, RANTES/CCL5, MIP1b/CCL4, Groa/CXCL1, interleukin 8 (IL-8)/CXCL8, tumor necrosis factor alpha (TNF-α), and IL-6. Our findings indicate that influenza virus infection may play a role as a causative agent of pancreatitis and diabetes in humans and other mammals.


Figures

Fig 1
Fig 1
Biochemical analysis. Kaplan-Meier analysis for the appearance of hyperlipasemia (A) and hyperglycemia (B) (plasma glucose, >27.78 mmol/liter) among mock-, H7N1-, and H7N3-infected turkeys. Differences were tested using the log rank statistic. The bar graphs show the frequency of events in relation to hyperlipasemia, hyperglycemia, and presence of viremia.
Fig 2
Fig 2
Histopathology and immunohistochemistry. (A) Turkey pancreas. Normal tissue is shown. Acinar cells containing zymogen granules in their cytoplasm are evident, associated with two nests of normal islet cells and a ductal structure (H&E). (B) Turkey pancreas. Shown is diffuse and severe necrosis of acinar cells (arrows) with severe inflammatory infiltrate (asterisks) (H&E). (C) Turkey pancreas. Most of the pancreas has been replaced by foci of fibrous connective tissue and lymphoid nodules, with some ductular proliferation. (D) Turkey pancreas. Shown is immunohistochemistry for avian influenza virus NP, with an area of necrosis, and positive nuclei and cytoplasm in both acinar and ductal cells.
Fig 3
Fig 3
Immunohistochemistry for insulin. Shown is turkey pancreas with representative islet structures before and after H7N3 infection at different time points.
Fig 4
Fig 4
Human influenza virus replication kinetics in pancreatic cell lines. Shown is the replication kinetics of A/New Caledonia/20/99 (H1N1) and A/Wisconsin/67/2005 (H3N2) in hCM and HPDE6 cells. hCM and HPDE6 cells were infected with each virus at an MOI of 0.001, and at 24, 48, and 72 h postinfection, supernatants from three infected and one mock-infected control well were harvested for virus isolation and qRRT-PCR. (A) Virus isolation results of H1N1 in hCM and HPDE6 cells. (B) Virus isolation results for H3N2 in hCM and HPDE6 cells. (C) qRRT-PCR results for H1N1 in hCM and HPDE6 cells. (D) qRRT-PCR results for H3N2 in hCM and HPDE6 cells. All results represent means plus standard deviations for three independent experiments.
Fig 5
Fig 5
Western blot analysis for the detection of viral nucleoprotein in pancreatic cell lines. Western blot analysis of H1N1 (a and b) and H3N2 (e and f) influenza virus NP (56 kDa) in hCM and HPDE6 cells. (c, d, g, and h) Samples were collected before infection (t0) and 24 (t24), 48 (t48), and 72 (t72) hours postinfection. β-Actin (42 kDa) was used as a loading control in order to ensure that the same amount of protein was tested for each sample.
Fig 6
Fig 6
Viral-RNA detection by RRT-PCR of the M gene in human pancreatic islets. Shown are two-way quadratic prediction plots with CIs for RRT-real-time CT values (ct) obtained from H1N1 (A and C) and H3N2 (B and D) (4.8 × 10³ PFU/well) pancreatic islet infection. For each virus, the CT trends in pancreatic islet pellets and supernatants from the day of infection (t0) until day 10 (t5) in the presence (left) or absence (middle) of TPCK-trypsin and as an average of the previous two conditions (right) are represented.
Fig 7
Fig 7
Viral-RNA detection by in situ hybridization in human pancreatic islets. Islets were infected with H1N1 and H3N2 by adding 100 μl of viral suspension containing a viral dilution of 4.8 × 10³ PFU/well. Mock-infected islets were left as a negative control. (A) Two days after infection, the presence of the viral-RNA molecules was detected on cytoembedded pancreatic islets upon addition of the Fast Red alkaline phosphatase substrate due to the formation of a colored precipitate. Bound viral mRNA was then visualized using either a standard bright-field or a fluorescence microscope (magnification, ×40). Arrows, viral-mRNA-positive cells. (B and C) Five days after infection, multiplex fluorescence-based in situ hybridization was performed, and after disaggregation, islet cells were cytocentrifuged onto glass slides. Viral-RNA-, insulin-, amylase-, and CK19-positive cells were assessed with a Carl Zeiss Axiovert 135TV fluorescence microscope. Quantification was performed using IN Cell Investigator software. Each dot represents the percentage of positive cells quantified on one systematically random field. Results from two experiments are shown. A Mann-Whitney U test was used for statistical analysis.
Fig 8
Fig 8
Virus RNA and insulin/amylase/CK19 localization. Islets were infected with H1N1 and H3N2 by adding 100 μl of viral suspension containing a viral dilution of 4.8 × 10³ PFU/well. Five days after infection, multiplex fluorescence-based in situ hybridization was performed using the Quantigene ViewRNA technique, based on multiple oligonucleotide probes and branched-DNA signal amplification technology, according to the manufacturer's instructions. (Left) The red signal corresponds to the presence of influenza virus RNA, and the green signal corresponds to the presence of insulin, amylase, or CK18 transcripts (magnification, ×63). White arrows, double-positive cells. (Right) Viral-RNA-, insulin-, amylase-, and CK19-positive cells were assessed with a Carl Zeiss Axiovert 135TV fluorescence microscope. Quantification was performed using IN Cell Investigator software. Each dot represents the percentage of positive cells quantified on one systematically random field. Results from two experiments are shown.
Fig 9
Fig 9
Cytokine/chemokine expression profile modification induced by human influenza A virus infection. Islets were infected with H1N1 and H3N2 by adding 100 μl of viral suspension containing two viral dilutions of 4.8 × 10³ or 4.8 × 10² PFU/well. Mock-infected islets were left as a negative control. Samples were collected every 48 h from the day of infection (t0) until day 10 (t10). The supernatant was collected and assayed for 50 cytokines. (A) Virus-induced modification in the islet cytokine/chemokine profile. The data are expressed as the maximum fold increase for each factor detected during culture in relation to mock-infected islets (n = 2). Dashed line, 5-fold-increase threshold. The error bars indicate standard deviations. Red items are factors with a >5-fold increased threshold. (B) IFN-γ-inducible chemokine CXCL9/MIG and CXCL10/IP-10 concentrations during 10 days of culture in the presence (+) or absence (−) of H1N1 and H3N2.

References

    1. Capua I, Alexander DJ. 2009. Avian influenza and Newcastle Disease, a field and laboratory manual. Springer, Berlin, Germany
    1. Harder TC, Vahlenkamp TW. 2010. Influenza virus infections in dogs and cats. Vet. Immunol. Immunopathol. 134:54–60 - PubMed
    1. Kuiken T, Rimmelzwaan G, van Riel D, van Amerongen G, Baars M, Fouchier R, Osterhaus A. 2004. Avian H5N1 influenza in cats. Science 306:241. - PubMed
    1. Rimmelzwaan GF, van Riel D, Baars M, Bestebroer TM, van Amerongen G, Fouchier RA, Osterhaus AD, Kuiken T. 2006. Influenza A virus (H5N1) infection in cats causes systemic disease with potential novel routes of virus spread within and between hosts. Am. J. Pathol. 168:176–183 - PMC - PubMed
    1. Abolnik C, Londt BZ, Manvell RJ, Shell W, Banks J, Gerdes GH, Akol G, Brown IH. 2009. Characterisation of a highly pathogenic influenza A virus of subtype H5N2 isolated from ostriches in South Africa in 2004. Influenza Other Respi. Viruses 3:63–68 - PMC - PubMed

Publication types

MeSH terms