

Transport efficiency and workload distribution in a mathematical model of the thick ascending limb
- PMID: 23097466
- PMCID: PMC3602701
- DOI: 10.1152/ajprenal.00101.2012
Transport efficiency and workload distribution in a mathematical model of the thick ascending limb
Abstract
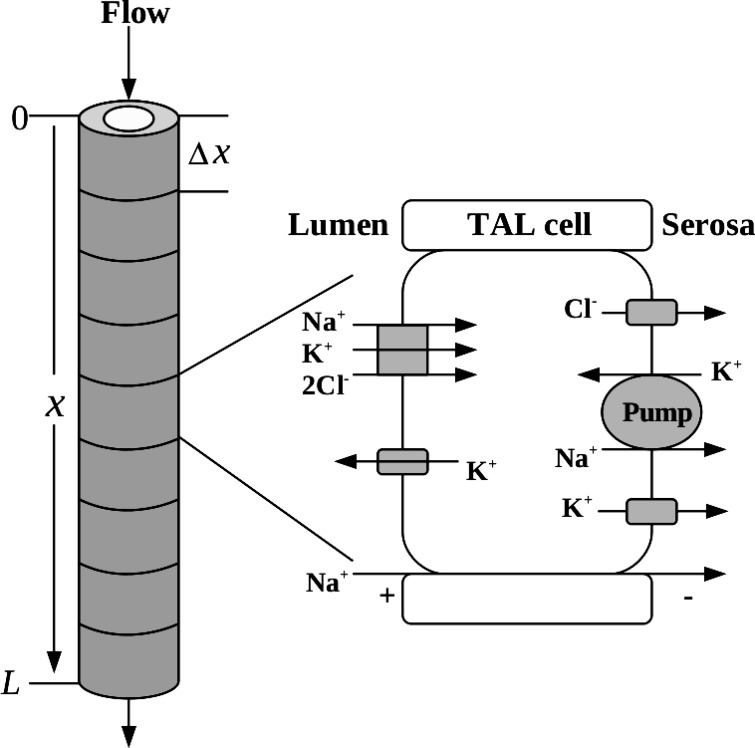
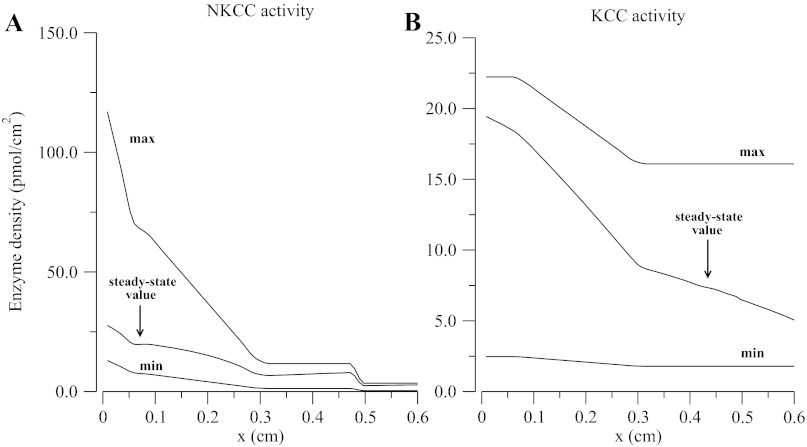
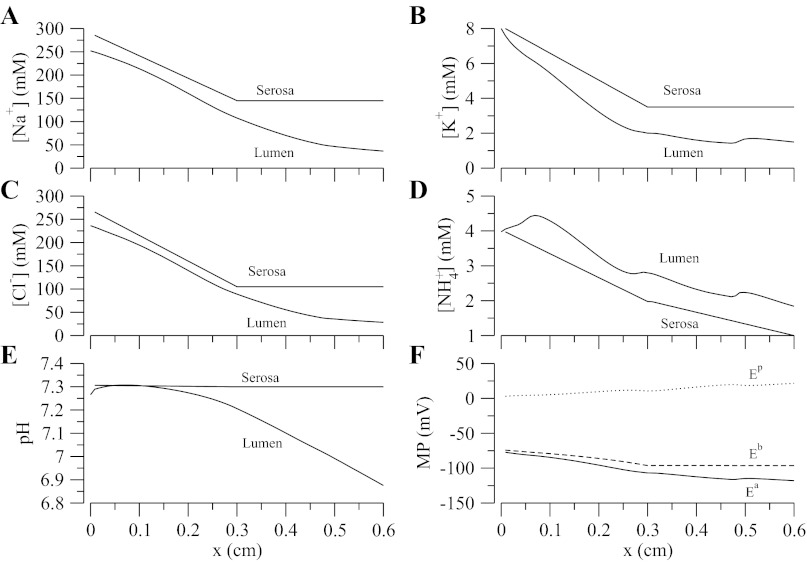
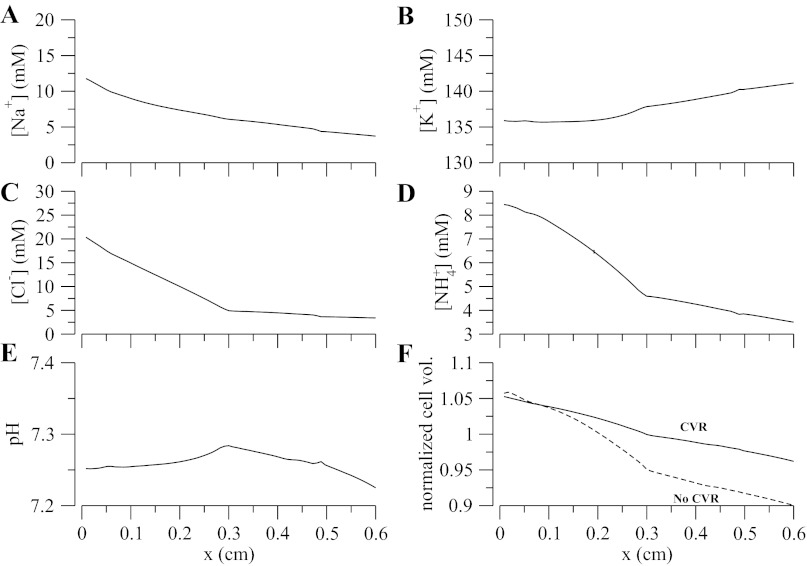
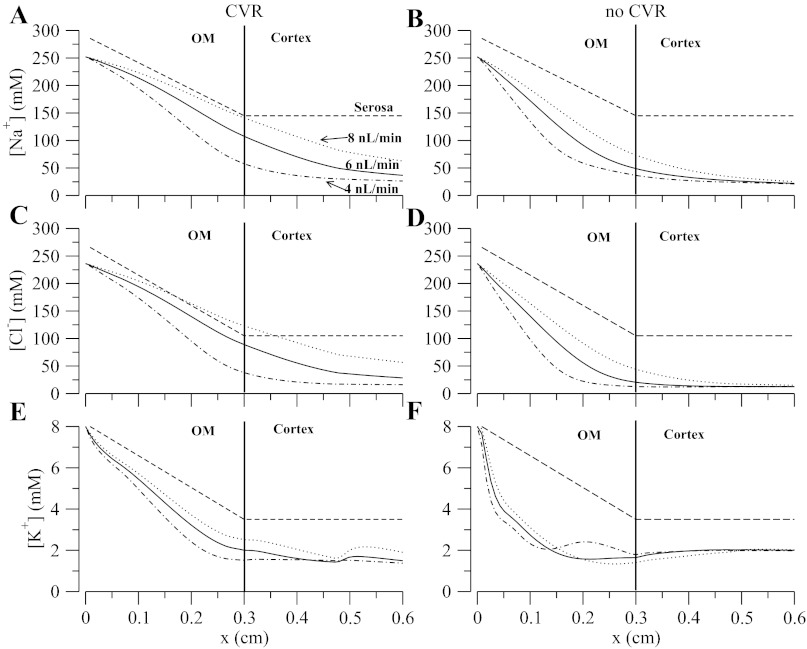
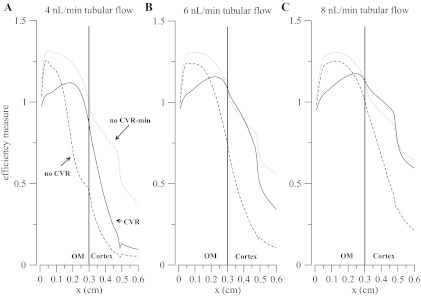
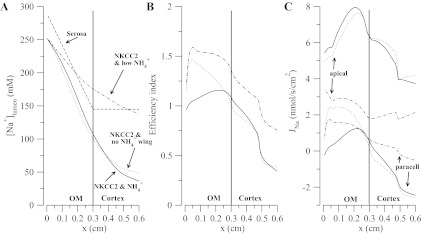
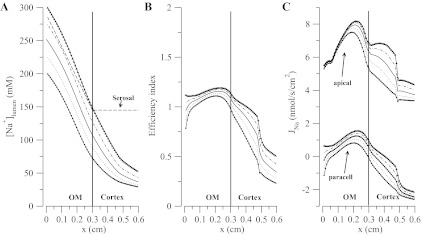
The thick ascending limb (TAL) is a major NaCl reabsorbing site in the nephron. Efficient reabsorption along that segment is thought to be a consequence of the establishment of a strong transepithelial potential that drives paracellular Na(+) uptake. We used a multicell mathematical model of the TAL to estimate the efficiency of Na(+) transport along the TAL and to examine factors that determine transport efficiency, given the condition that TAL outflow must be adequately dilute. The TAL model consists of a series of epithelial cell models that represent all major solutes and transport pathways. Model equations describe luminal flows, based on mass conservation and electroneutrality constraints. Empirical descriptions of cell volume regulation (CVR) and pH control were implemented, together with the tubuloglomerular feedback (TGF) system. Transport efficiency was calculated as the ratio of total net Na(+) transport (i.e., paracellular and transcellular transport) to transcellular Na(+) transport. Model predictions suggest that 1) the transepithelial Na(+) concentration gradient is a major determinant of transport efficiency; 2) CVR in individual cells influences the distribution of net Na(+) transport along the TAL; 3) CVR responses in conjunction with TGF maintain luminal Na(+) concentration well above static head levels in the cortical TAL, thereby preventing large decreases in transport efficiency; and 4) under the condition that the distribution of Na(+) transport along the TAL is quasi-uniform, the tubular fluid axial Cl(-) concentration gradient near the macula densa is sufficiently steep to yield a TGF gain consistent with experimental data.
Figures


Similar articles
-
Fluid dilution and efficiency of Na(+) transport in a mathematical model of a thick ascending limb cell.Am J Physiol Renal Physiol. 2013 Mar 15;304(6):F634-52. doi: 10.1152/ajprenal.00100.2012. Epub 2012 Oct 24. Am J Physiol Renal Physiol. 2013. PMID: 23097469 Free PMC article.
-
Sodium reabsorption in thick ascending limb of Henle's loop: effect of potassium channel blockade in vivo.Br J Pharmacol. 2000 Jul;130(6):1255-62. doi: 10.1038/sj.bjp.0703429. Br J Pharmacol. 2000. PMID: 10903963 Free PMC article.
-
Effects of NKCC2 isoform regulation on NaCl transport in thick ascending limb and macula densa: a modeling study.Am J Physiol Renal Physiol. 2014 Jul 15;307(2):F137-46. doi: 10.1152/ajprenal.00158.2014. Epub 2014 May 21. Am J Physiol Renal Physiol. 2014. PMID: 24848496 Free PMC article.
-
Heterogeneity of tight junctions in the thick ascending limb.Ann N Y Acad Sci. 2017 Oct;1405(1):5-15. doi: 10.1111/nyas.13400. Epub 2017 Jun 19. Ann N Y Acad Sci. 2017. PMID: 28628195 Review.
-
Medullary and cortical thick ascending limb: similarities and differences.Am J Physiol Renal Physiol. 2020 Feb 1;318(2):F422-F442. doi: 10.1152/ajprenal.00261.2019. Epub 2019 Dec 16. Am J Physiol Renal Physiol. 2020. PMID: 31841389 Review.
Cited by
-
Renal medullary and urinary oxygen tension during cardiopulmonary bypass in the rat.Math Med Biol. 2017 Sep 1;34(3):313-333. doi: 10.1093/imammb/dqw010. Math Med Biol. 2017. PMID: 27281792 Free PMC article.
-
Impact of nitric-oxide-mediated vasodilation and oxidative stress on renal medullary oxygenation: a modeling study.Am J Physiol Renal Physiol. 2016 Feb 1;310(3):F237-47. doi: 10.1152/ajprenal.00334.2015. Epub 2015 Oct 14. Am J Physiol Renal Physiol. 2016. PMID: 26831340 Free PMC article.
-
Modeling Glucose Metabolism in the Kidney.Bull Math Biol. 2016 Jun;78(6):1318-36. doi: 10.1007/s11538-016-0188-7. Epub 2016 Jul 1. Bull Math Biol. 2016. PMID: 27371260 Free PMC article.
-
Mathematical modeling of kidney transport.Wiley Interdiscip Rev Syst Biol Med. 2013 Sep-Oct;5(5):557-73. doi: 10.1002/wsbm.1232. Epub 2013 Jul 12. Wiley Interdiscip Rev Syst Biol Med. 2013. PMID: 23852667 Free PMC article. Review.
-
Claudins in Renal Physiology and Pathology.Genes (Basel). 2020 Mar 10;11(3):290. doi: 10.3390/genes11030290. Genes (Basel). 2020. PMID: 32164158 Free PMC article. Review.
References
-
- Boron WF, Boulpaep EL. Medical Physiology (1st ed.). New York: Saunders, 2003, p. 776–780, 2003
-
- Briggs JP, Schnermann J, Schubert G. In situ studies of the distal convoluted tubule in the rat. I. Evidence for NaCl secretion. Am J Physiol Renal Fluid Electrolyte Physiol 243: F160–F166, 1982 - PubMed
-
- Casellas D, Moore LC. Autoregulation and tubuloglomerular feedback in juxtamedullary glomerular arterioles. Am J Physiol Renal Fluid Electrolyte Physiol 258: F660–F669, 1990 - PubMed
-
- Corcia W, Caplan SR. Effect of furosemide on the thermodynamic parameters of frog skin. Am J Physiol Renal Fluid Electrolyte Physiol 243: F588–F592, 1982 - PubMed
-
- de Rouffignac C, Bonlavet JP. Variations in glomerular filtration rate of single superficial and deep nephrons under various conditions of sodium intake in the rat. Pflügers Arch 317: 141–156, 1970 - PubMed
Publication types
MeSH terms
Substances
Grants and funding
LinkOut - more resources
Full Text Sources
Other Literature Sources
Miscellaneous