. 2012 Dec;23(24):4689-700.
doi: 10.1091/mbc.E12-09-0673. Epub 2012 Oct 24.

LPIAT1 regulates arachidonic acid content in phosphatidylinositol and is required for cortical lamination in mice

Affiliations

LPIAT1 regulates arachidonic acid content in phosphatidylinositol and is required for cortical lamination in mice

Hyeon-Cheol Lee et al. Mol Biol Cell. 2012 Dec.

Abstract

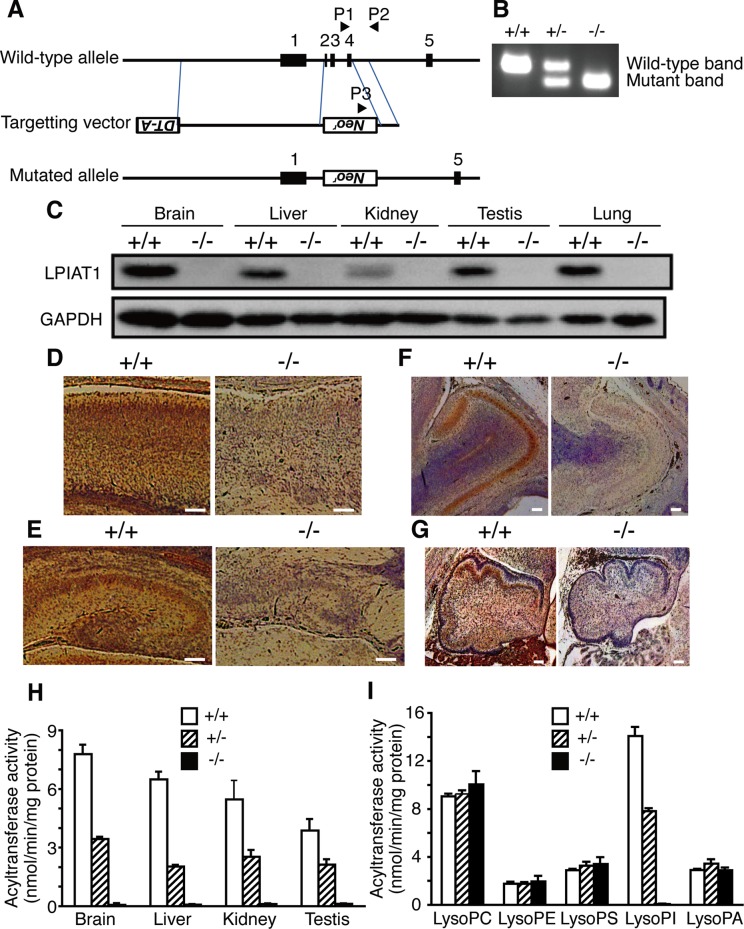
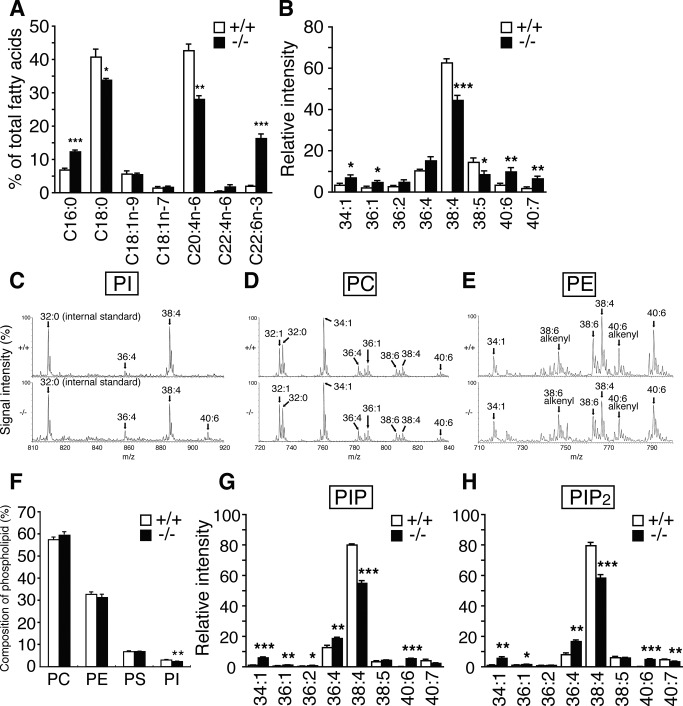
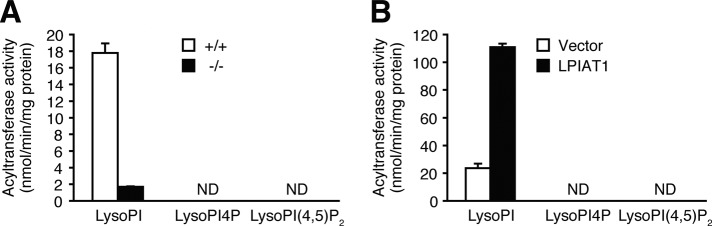
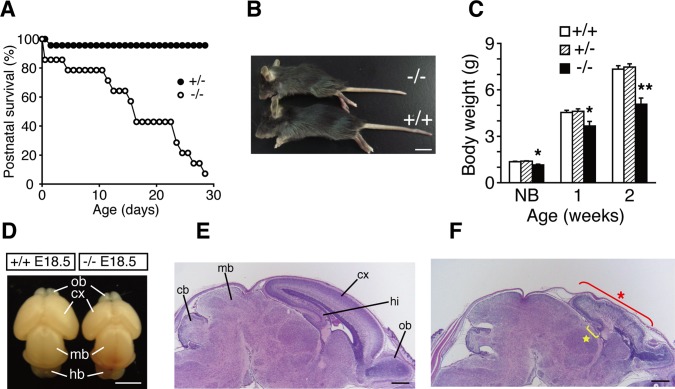
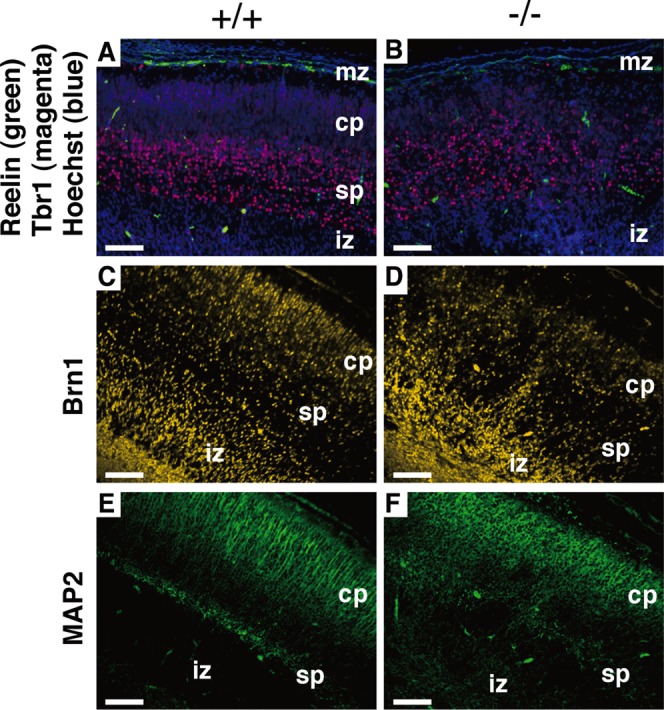
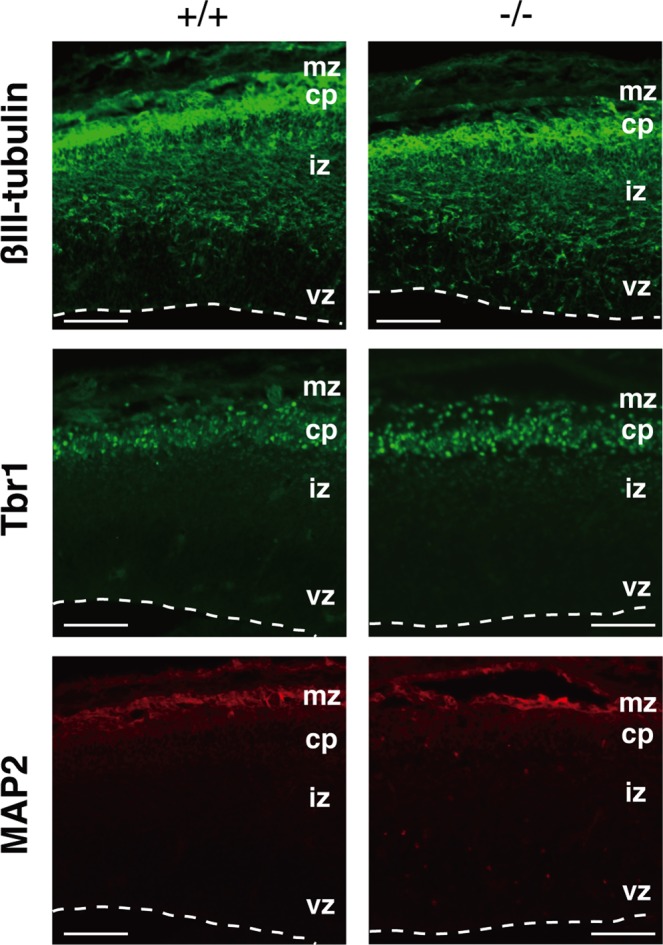
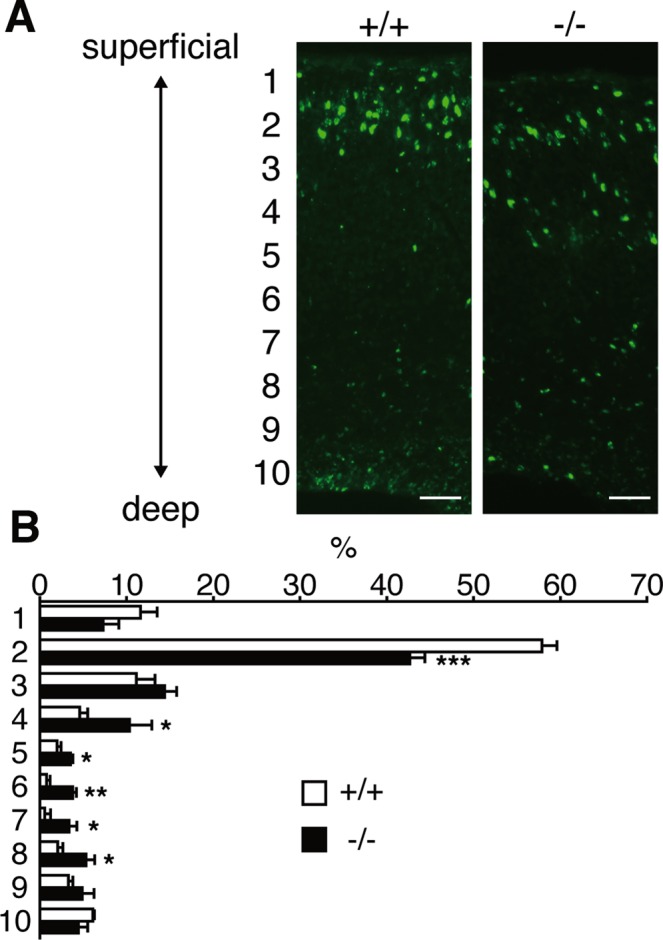
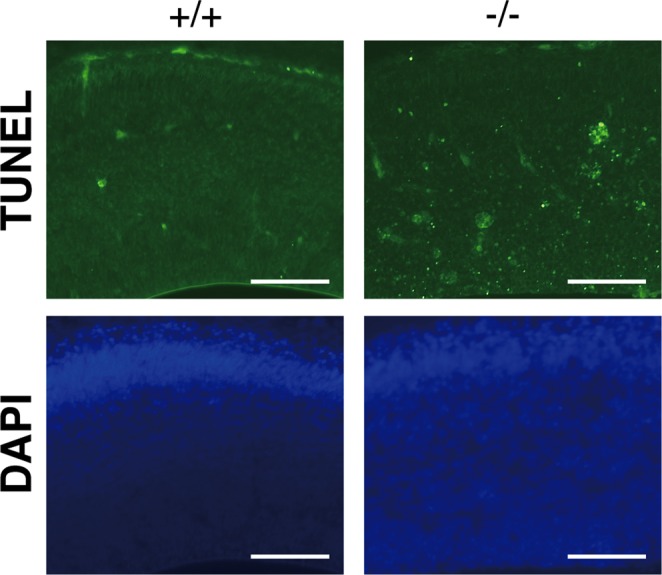
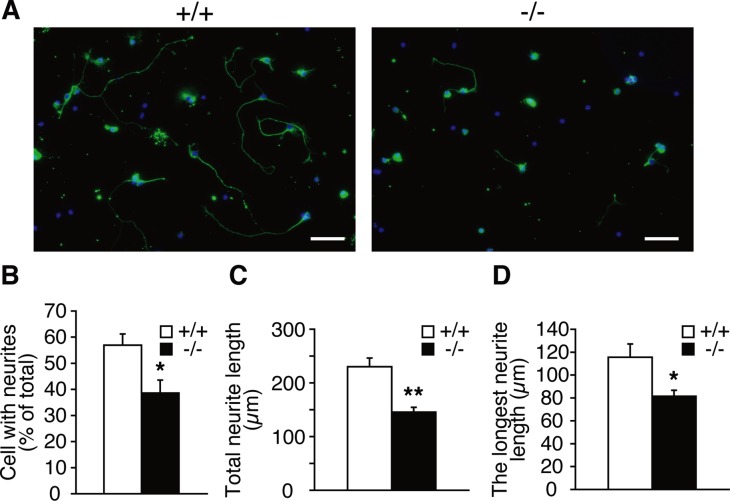
Dietary arachidonic acid (AA) has roles in growth, neuronal development, and cognitive function in infants. AA is remarkably enriched in phosphatidylinositol (PI), an important constituent of biological membranes in mammals; however, the physiological significance of AA-containing PI remains unknown. In an RNA interference-based genetic screen using Caenorhabditis elegans, we recently cloned mboa-7 as an acyltransferase that selectively incorporates AA into PI. Here we show that lysophosphatidylinositol acyltransferase 1 (LPIAT1, also known as MBOAT7), the closest mammalian homologue, plays a crucial role in brain development in mice. Lpiat1(-/-) mice show almost no LPIAT activity with arachidonoyl-CoA as an acyl donor and show reduced AA contents in PI and PI phosphates. Lpiat1(-/-) mice die within a month and show atrophy of the cerebral cortex and hippocampus. Immunohistochemical analysis reveals disordered cortical lamination and delayed neuronal migration in the cortex of E18.5 Lpiat1(-/-) mice. LPIAT1 deficiency also causes disordered neuronal processes in the cortex and reduced neurite outgrowth in vitro. Taken together, these results demonstrate that AA-containing PI/PI phosphates play an important role in normal cortical lamination during brain development in mice.


Figures

FIGURE 1:
FIGURE 1:
Lpiat1−/ mice lack AA-CoA:LPIAT activity. (A) Diagram of the Lpiat1 genomic locus and the targeting vector. The positions of the PCR primers (P1, P2, and P3) are indicated. All three primers were used in the same PCR. (B) PCR analysis of genomic DNAs from Lpiat1+/+, Lpiat1+/−, and Lpiat1−/− mice. (C) Immunoblot analysis of LPIAT1. Each tissue was prepared from 2-wk-old Lpiat1+/+ and Lpiat1−/− mice. Control GAPDH was run simultaneously in a different gel. The same amount of protein was loaded in each lane. (D–G) LPIAT1 expression in the brain. Sagittal sections of the brains from E18.5 Lpiat1+/+ and Lpiat1−/− littermates were stained with antibodies against mouse LPIAT1. Neocortex (D), hippocampus (E), olfactory bulb (F), and cerebellum (G) are shown. LPIAT1 was also detected in granule cells in accessory olfactory bulb. Scale bar, 100 μm. (H) AA-CoA:LPIAT activity in the membrane fractions of each tissue from Lpiat1+/+, Lpiat1+/−, and Lpiat1−/− mice at 2 wk of age. [14C]AA-CoA, lysoPI, and 5 μg of protein were used. Data are means ± SD (n = 3). (I) AA-CoA:lysophospholipid acyltransferase activity of the Lpiat1+/+, Lpiat1+/−, and Lpiat1−/− brains using the indicated lysophospholipids as acyl acceptors. PS, phosphatidylserine; PA, phosphatidic acid. Protein at 20 μg was used. Data are means ± SD (n = 3).
FIGURE 2:
FIGURE 2:
Lipid analysis of Lpiat1−/ mice. (A) Analysis of PI fatty acid composition of the brains by gas chromatography. C16:0, palmitic acid; C18:0, stearic acid; C18:1n-9, oleic acid; C18:1n-7, vaccenic acid; C20:4n-6, arachidonic acid; C22:4n-6, docosatetraenoic acid; C22:6n-3, docosahexaenoic acid. Data are means ± SEM (n = 3). *p < 0.05; **p < 0.01; ***p < 0.001. The unpaired, two-tailed t test was used. (B) LC-MS/MS analysis of PI. Negative-ionization LC-MS spectra of PI molecular species of the Lpiat1+/+ and Lpiat1−/ brains. 34:1, 16:0/18:1; 36:1, 18:0/18:1; 36:2, 18:1/18:1; 36:4, 16:0/20:4; 38:4, 18:0/20:4; 38:5, 18:1/20:4; 40:6, 18:0/22:6; 40:7, 18:1/22:6. Data are means ± SEM (n = 5). *p < 0.05; **p < 0.01; ***p < 0.001. The unpaired, two-tailed t test was used. (C) Negative-ionization LC-MS spectra of PI molecular species of the Lpiat1+/+ (top) and Lpiat1−/− (bottom) brains. 36:4, 16:0/20:4; 38:4, 18:0/20:4; 40:6, 18:0/22:6. (D) Positive-ionization LC-MS spectra of PC molecular species. 32:1, mainly 16:0/16:1; 32:0, 16:0/16:0; 34:1, 16:0/18:1; 36:4, mainly 16:0/20:4; 36:1, 18:0/18:1; 38:6, 16:0/22:6; 38:4, mainly 18:0/20:4; 40:6, 18:0/22:6. (E) Positive-ionization LC-MS spectra of PE molecular species. 34:1, 16:0/18:1; 38:6 alkenyl, 16:0 alkenyl/22:6; 38:6, mainly 16:0/22:6; 38:4, mainly 18:0/20:4; 40:6 alkenyl, 18:0 alkenyl/22:6; 40:6, 18:0/22:6. (F) The content of individual phospholipid of the brains. Data are means ± SEM (n = 4-5). *p < 0.05. The unpaired, two-tailed t test was used. (G, H) LC/MS analysis of PIP (primarily PI4P; G) and PIP2 (primarily PI(4,5)P2; H) of Lpiat1+/+ and Lpiat1−/− mouse hippocampus. Data are means ± SEM (n = 3). *p < 0.05; **p < 0.01; ***p < 0.001. Unpaired, two-tailed t test was used.
FIGURE 3:
FIGURE 3:
LPIAT1 does not use lysoPI4P or lysoPI(4,5)P2 as acyl acceptors. (A) AA-CoA:acyltransferase activity toward lysoPI, lysoPI4P, or lysoPI(4,5)P2 in the membrane fractions of the Lpiat1+/+ and Lpiat1−/− brains at P0. Protein at 5 μg was used. ND, not detected or present only in trace amounts. Data are means ± SD (n = 3). (B) AA-CoA:acyltransferase activity toward lysoPI, lysoPI4P, or lysoPI(4,5)P2 in the membrane fractions of HEK 293A cells transfected with vector control or Lpiat1 expression plasmid. ND, not detected or present only in trace amounts. Protein at 1 μg was used. Data are means ± SD (n = 3).
FIGURE 4:
FIGURE 4:
Abnormal morphology of the Lpiat1−/ brain. (A) Juvenile lethality of Lpiat1−/ mice (n = 14). (B) Representative photograph of Lpiat1−/ mouse compared with a wild-type littermate at 3 wk of age. Scale bar, 1 cm. (C) Body weights of Lpiat1+/+, Lpiat1+/, and Lpiat1−/ mice at different points in time. Littermates of all genotypes (+/+, n = 29; +/−, n = 41; −/−, n = 14) were weighed at 1 and 2 wk of age. Newborn littermates (+/+, n = 6; +/−, n = 12; −/−, n = 4) were weighed before killing for primary hippocampal culture (see Figure 9). NB, newborn. Data are means ± SEM *p < 0.05; **p < 0.01. The analysis of variance with Tukey-Kramer post hoc test was used. (D) Brains from Lpiat1+/+ and Lpiat1−/ littermates at E18.5. cx, cortex; hb, hindbrain; mb, midbrain; ob, olfactory bulb. Scale bar, 2.5 mm. (E, F) Sagittal sections of the brains from E18.5 Lpiat1+/+ (E) and Lpiat1−/ (F) littermates were stained with hematoxylin and eosin (H&E). cb, cerebellum; cx, cortex; hi, hippocampus; mb, midbrain; ob, olfactory bulb. The red asterisk indicates the atrophic cortex, and the yellow star indicates the atrophic hippocampus. Scale bar, 500 μm.
FIGURE 5:
FIGURE 5:
Abnormal cortical lamination in Lpiat1−/− mice. Sagittal sections of neocortices from E18.5 Lpiat1+/+ (A, C, E) and Lpiat1−/ (B, D, F) littermates were stained with antibodies against Reelin and Tbr1, and DNA dye Hoechst 33342 (green, magenta, and blue, respectively; A, B), Brn1 (yellow; C, D), and MAP2 (green; E, F). cp, cortical plate; iz, intermediate zone; mz, maginal zone; sp, subplate. Scale bar, 100 μm.
FIGURE 6:
FIGURE 6:
Loss of LPIAT1 does not affect neuronal differentiation. Coronal sections of the E14.5 neocortices were stained with antibodies against βIII-tubulin, Tbr1, and MAP2. cp, cortical plate; iz, intermediate zone; mz, maginal zone; vz, ventricular zone. Scale bar, 50 μm.
FIGURE 7:
FIGURE 7:
Neuronal migration is delayed in Lpiat1−/− mice. (A) Coronal sections of neocortices from E18.5 Lpiat1+/+ and Lpiat1−/ littermates labeled with BrdU at E15.5. Scale bar, 50 μm. (B) The radial distribution of BrdU-labeled cells. Data are means ± SEM (n = 4). *p < 0.05; **p < 0.01; ***p < 0.001. Unpaired, two-tailed t test was used.
FIGURE 8:
FIGURE 8:
Loss of LPIAT1 causes increased apoptosis in early corticogenesis. Apoptotic cell death in coronal sections was examined by TUNEL staining at E14.5. Scale bar, 100 μm.
FIGURE 9:
FIGURE 9:
LPIAT1 deficiency causes defects in neurite elongation. (A) Cultured hippocampal neurons from P0 brains were stained with neuronal marker anti–βIII-tubulin antibody (green) and 4′,6-diamidino-2-phenylindole (blue) at DIV3. Scale bar, 50 μm. Percentage of cells with neurites (B), total neurite length (C), and longest neurite length (D) of cultured hippocampal neurons from Lpiat1+/+ and Lpiat1−/ mice. At least 50 neurons were measured for each group. Data are means ± SEM (n = 4). *p < 0.05; **p < 0.01. Unpaired, two-tailed t test was used.

References

    1. Abad-Jorge A. The role of DHA and ARA in infant nutrition and neurodevelopmental outcomes. Today's Dietician. 2008;10:66.
    1. Alcántara S, Ruiz M, D'Arcangelo G, Ezan F, de Lecea L, Curran T, Sotelo C, Soriano E. Regional and cellular patterns of reelin mRNA expression in the forebrain of the developing and adult mouse. J Neurosci. 1998;18:7779–7799. - PMC - PubMed
    1. Backer JM. The regulation and function of class III PI3Ks: novel roles for Vps34. Biochem J. 2008;410:1–17. - PubMed
    1. Baker RR, Thompson W. Selective acylation of 1-acylglycerophosphorylinositol by rat brain microsomes. Comparison with 1-acylglycerophosphorylcholine. J Biol Chem. 1973;248:7060–7065. - PubMed
    1. Bannai H, Inoue T, Nakayama T, Hattori M, Mikoshiba K. Kinesin dependent, rapid, bi-directional transport of ER sub-compartment in dendrites of hippocampal neurons. J Cell Sci. 2004;117:163–175. - PubMed

Publication types

MeSH terms

Substances