. 2012 Dec 22;279(1749):4969-76.
doi: 10.1098/rspb.2012.1902. Epub 2012 Oct 24.

Long-term differences in extinction risk among the seven forms of rarity

Affiliations

Long-term differences in extinction risk among the seven forms of rarity

Paul G Harnik et al. Proc Biol Sci. .

Abstract

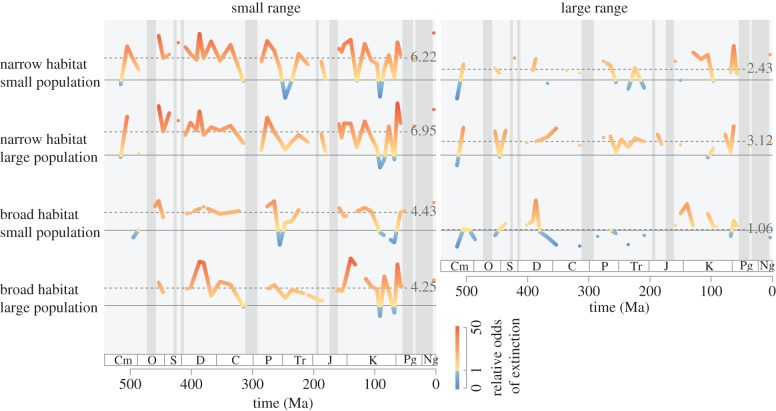
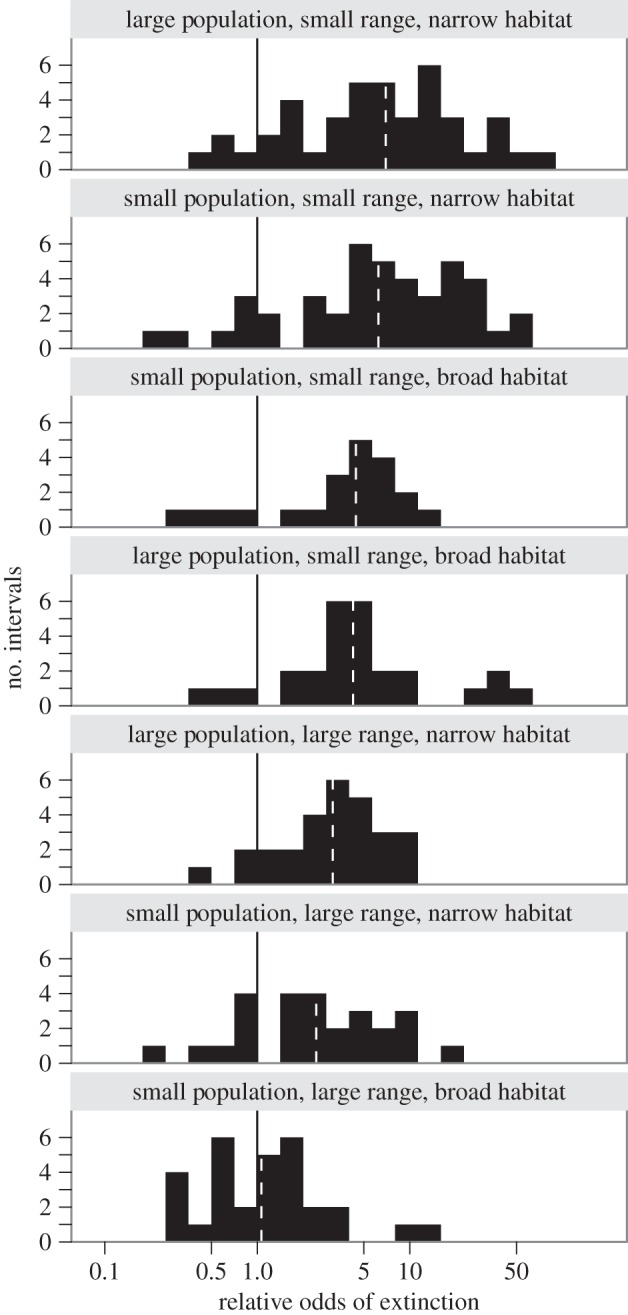
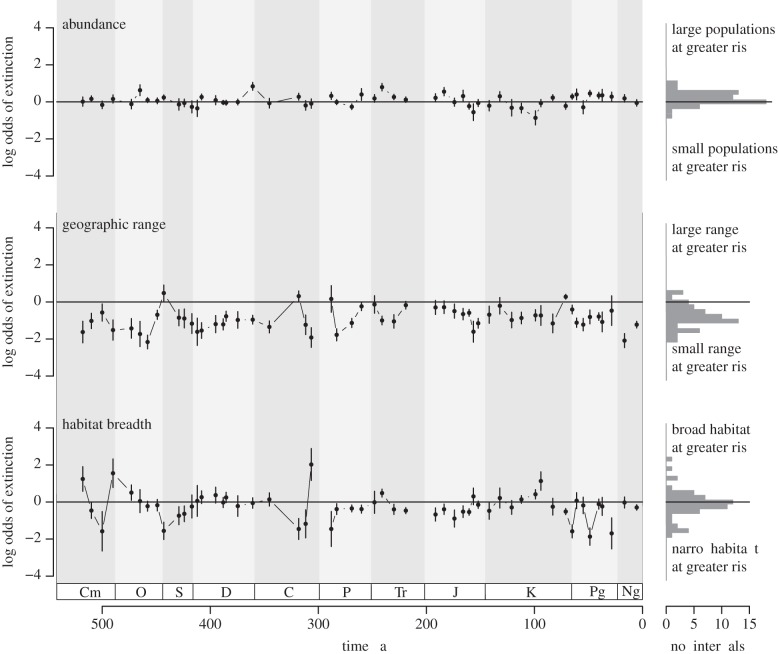
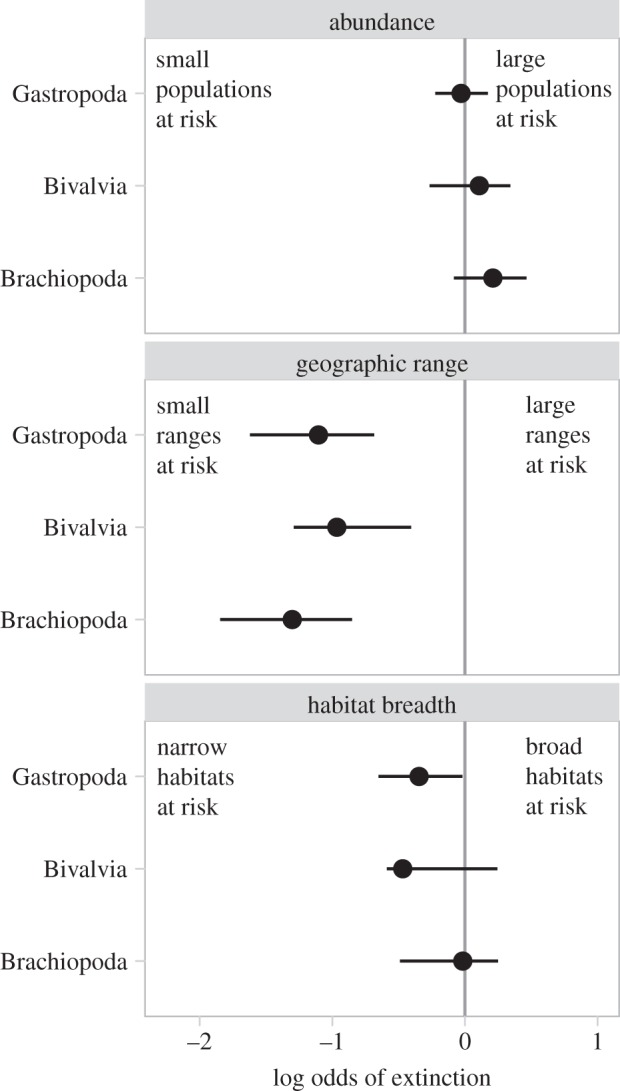
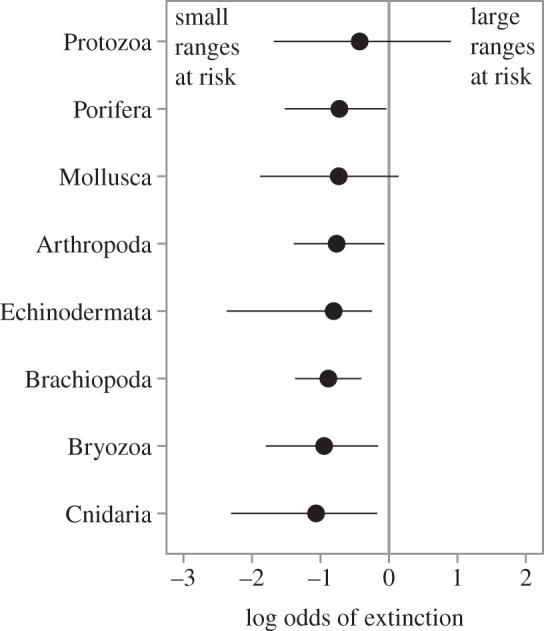
Rarity is widely used to predict the vulnerability of species to extinction. Species can be rare in markedly different ways, but the relative impacts of these different forms of rarity on extinction risk are poorly known and cannot be determined through observations of species that are not yet extinct. The fossil record provides a valuable archive with which we can directly determine which aspects of rarity lead to the greatest risk. Previous palaeontological analyses confirm that rarity is associated with extinction risk, but the relative contributions of different types of rarity to extinction risk remain unknown because their impacts have never been examined simultaneously. Here, we analyse a global database of fossil marine animals spanning the past 500 million years, examining differential extinction with respect to multiple rarity types within each geological stage. We observe systematic differences in extinction risk over time among marine genera classified according to their rarity. Geographic range played a primary role in determining extinction, and habitat breadth a secondary role, whereas local abundance had little effect. These results suggest that current reductions in geographic range size will lead to pronounced increases in long-term extinction risk even if local populations are relatively large at present.


Figures

Figure 1.
Figure 1.
The odds of extinction for genera characterized by different forms of rarity relative to genera considered common by all measures. Warmer colours indicate greater odds of extinction on a logarithmic scale. The solid horizontal lines denote equal odds of extinction between rare and common genera. Dashed lines and inset values denote the median relative odds of extinction for each rarity class over the last 500 million years. The odds ratio is presented for all intervals in which both rare and common genera were observed to go extinct, and cannot be calculated for the 18 shaded intervals (dark grey) in which no common genera were observed to go extinct.
Figure 2.
Figure 2.
The relative odds of extinction for the seven forms of rarity over the last 500 million years, with risk increasing from the bottom to top panels. Data are from figure 1, and are the number of time intervals characterized by different odds of extinction for genera in each rarity class relative to common genera. The solid black lines denote equal odds of extinction between rare and common genera. Dashed white lines denote the median relative odds of extinction for each rarity class over the last 500 million years. At the greatest risk of extinction are genera with both small ranges and narrow habitat breadth. Broader habitat breadth helps buffer narrowly distributed genera from extinction, whereas variation in the population size has negligible effect.
Figure 3.
Figure 3.
The relationships between extinction risk and abundance, geographic range and habitat breadth over the last 500 million years estimated using a multiple logistic regression model containing the three continuous predictor variables. The solid line indicates no association between the predictor variable and extinction risk. Negative values indicate an inverse association between the predictor and extinction risk. Histograms for each aspect of rarity present the number of time intervals characterized by different log odds of extinction. The associations between each aspect of rarity and extinction risk in this continuous analysis are comparable with those observed in the analysis of discrete rarity classes.
Figure 4.
Figure 4.
The log odds of extinction for gastropod, bivalve and brachiopod genera over geologic time according to their abundance, geographic range and habitat breadth. Values are the median (circles) and interquartile range of log odds values for geological stages, generated by fitting a continuous multiple logistic regression model separately to data for each clade in stages for which more than 50 genera in the clade have associated rarity data. The solid vertical line indicates no association between the predictor variable and extinction risk. Each group shows selectivity patterns consistent with the pooled analysis and there are no significant differences between clades in their distributions of log odds values for each predictor variable.
Figure 5.
Figure 5.
The log odds of extinction for genera belonging to different major marine clades over the Phanerozoic according to their geographic range. Values are the median (circles) and range (minimum to maximum) of log odds values, generated by fitting a continuous logistic regression model separately to the data for each clade using stages in which more than 50 genera in the clade had associated geographic range data. The solid vertical line indicates no association between the geographic range and extinction risk. All seven animal phyla and marine protists exhibit a consistent inverse relationship between geographic range size and extinction risk, with only two clades which contain some pelagic taxa (Protozoa and Mollusca) exhibiting positive log odds values in a limited number of intervals.

References

    1. IUCN 2001. Red list categories and criteria, version 3.1. IUCN Species Survival Commission. Gland, Switzerland: IUCN
    1. McKinney M. L. 1997. Extinction vulnerability and selectivity: combining ecological and paleontological views. Annu. Rev. Ecol. Syst. 28, 495–516 10.1146/annurev.ecolsys.28.1.495 (doi:10.1146/annurev.ecolsys.28.1.495) - DOI
    1. Harnik P. G. 2011. Direct and indirect effects of biological factors on extinction risk in fossil bivalves. Proc. Natl Acad. Sci. USA 108, 13 594–13 599 10.1073/pnas.1100572108 (doi:10.1073/pnas.1100572108) - DOI - PMC - PubMed
    1. Payne J. L., Truebe S., Nützel A., Chang E. T. 2011. Local and global abundance associated with extinction risk in late Paleozoic and early Mesozoic gastropods. Paleobiology 37, 616–632 10.1666/10037.1 (doi:10.1666/10037.1) - DOI
    1. Kiessling W., Aberhan M. 2007. Geographical distribution and extinction risk: lessons from Triassic–Jurassic marine benthic organisms. J. Biogeogr. 34, 1473–1489 10.1111/j.1365-2699.2007.01709.x (doi:10.1111/j.1365-2699.2007.01709.x) - DOI

Publication types