. 2012 Oct;14(10):905-14.
doi: 10.1593/neo.121192.

Role of transcriptional corepressor CtBP1 in prostate cancer progression

Affiliations

Role of transcriptional corepressor CtBP1 in prostate cancer progression

Rui Wang et al. Neoplasia. 2012 Oct.

Abstract

Transcriptional repressors and corepressors play a critical role in cellular homeostasis and are frequently altered in cancer. C-terminal binding protein 1 (CtBP1), a transcriptional corepressor that regulates the expression of tumor suppressors and genes involved in cell death, is known to play a role in multiple cancers. In this study, we observed the overexpression and mislocalization of CtBP1 in metastatic prostate cancer and demonstrated the functional significance of CtBP1 in prostate cancer progression. Transient and stable knockdown of CtBP1 in prostate cancer cells inhibited their proliferation and invasion. Expression profiling studies of prostate cancer cell lines revealed that multiple tumor suppressor genes are repressed by CtBP1. Furthermore, our studies indicate a role for CtBP1 in conferring radiation resistance to prostate cancer cell lines. In vivo studies using chicken chorioallantoic membrane assay, xenograft studies, and murine metastasis models suggested a role for CtBP1 in prostate tumor growth and metastasis. Taken together, our studies demonstrated that dysregulated expression of CtBP1 plays an important role in prostate cancer progression and may serve as a viable therapeutic target.


Figures

Figure 1
Figure 1
Identification of CtBP1 overexpression in prostate cancer (PCa). (A) CtBP1 expression in the prostate cancer gene expression profiling study. Data were obtained from benign, prostate cancer, and metastatic prostate cancer (MET) tissue expression profiling. (B) Real-time qPCR of CtBP1 transcripts in benign and prostate cancer. Ratio was calculated relative to GAPDH. The boxes extend from the lower to the upper quartile of the data, and whiskers extend to the most extreme data point that is no more than 1.5 times the interquartile range from the box. Points beyond this range are shown as black dots. (C) Expression of CtBP1 protein in prostate cancer. Extracts from prostate specimens were assessed for expression of CtBP1 by immunoblot analysis. β-Actin was used as a loading control. (D) Immunohistochemical analysis of CtBP1 in prostate cancer. Left, benign prostate epithelia exhibiting nuclear staining. Localized prostate cancer exhibiting nuclear and cytoplasmic staining. Metastatic prostate cancer shows increased cytoplasmic CtBP1 staining.
Figure 2
Figure 2
CtBP1 plays a role in cell proliferation and invasion. (A) Knockdown of CtBP1 in prostate cancer cell lines. Immunoblot analysis using lysates from aggressive prostate cell lines DU145 and PC3 treated with two CtBP1-specific shRNA lentivirus and nontargeting control lentivirus. β-Actin was used as control. (B, C) Knockdown of the CtBP1 reduces prostate cancer cell proliferation. Cell proliferation was measured using cells transduced with CtBP1 shRNA duplex or control nontargeting shRNA using DU145 and PC3 cells. (D, E) Knockdown of the CtBP1 reduces prostate cancer invasion. DU145 and PC3 cells in which CtBP1 was stably knocked down using two specific shRNA lentivirus against CtBP1 were used in Boyden chamber matrigel invasion assay. Nontargeting shRNA lentivirus served as control. Invaded cells were stained and absorbance was measured.
Figure 3
Figure 3
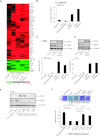
CtBP1 knockdown reactivate tumor suppressors in prostate cancer. (A) Heat map of genes that are significantly altered by CtBP1 stable knockdown in LNCaP, PC3, and DU145 cells. Log2(Cy5/Cy3) ratios are shown for each expression array. Red and green represent upregulated and downregulated genes, respectively, in CtBP1 knockdown cells, relative to the median of the reference pool. Black signifies no change in expression. Known and putative tumor and metastasis suppressors are indicated in red letters. The color bar indicates the fold change; red denotes up-regulation and green represents down-regulation. (B) CtBP1 regulates expression of E-cadherin. E-cadherin expression was measured in CtBP1 stable knockdown DU145 cell lines and compared to control cell lines by qPCR. (C and D) CtBP1 regulates expression of LCN2. LCN2 expression was measured in CtBP1 stable knockdown DU145 and PC3 cell lines by qPCR and immunoblot analysis. (E) LCN2 knockdown in stable CtBP1 knockdown PC3 cells. Expression of LCN2 and CtBP1 were tested by immunoblot. (F) LCN2 knockdown enhances invasion. LCN2 was targeted by two independent specific siRNA in stable CtBP1 knockdown PC3 cell line, and invasion experiment was performed using Boyden chamber matrigel assay (photomicrographs are shown in the inset; blue staining represents invaded cells).
Figure 4
Figure 4
Role of CtBP1 in radiation resistance. Effects of CtBP1 knockdown on clonogenic survival of DU145 cells. (A) Stable clones of CtBP1 along with controls were radiated with clinically relevant doses of radiation and immediately plated for clonogenic survival. (B) Phospho-H2AX immunoblot after radiation treatment of control and stable CtBP1 knockdown cells. GAPDH was used as a loading control.
Figure 5
Figure 5
CtBP1 knockdown reduces prostate tumor growth in vivo. (A, B) Chicken CAM assay. Tumor growth was measured in CAM models using DU145 and PC3 stable CtBP1 knockdown cells or control nontargeting shRNA stable cells. Tumors were harvested and tumor weights were measured. (C) CtBP1 knockdown reduces metastasis of DU145 cells in CAM assay. Metastasized cells to the lungs of chicken embryos were quantified using human Alu-specific PCR. (D) CtBP1 knockdown inhibits tumor growth in a mouse xenograft model. Plot of mean tumor volume trajectories over time for the mice inoculated with CtBP1 stable knockdown pools (dotted line), CtBP1 stable knockdown clone (broken line), and control (solid line) cells. Error bars represent SEM. (E) CtBP1 knockdown inhibits tumor metastasis. PC3 luciferase stable CTBP1 knockdown or nontargeting control shRNA-treated cells were used in this study. At 2, 4, 6, and 8 weeks after transplantation, the establishment of metastases was followed by BLI. Data are representative of BLI of mice that had developed metastases.

References

    1. Grooteclaes M, Deveraux Q, Hildebrand J, Zhang Q, Goodman RH, Frisch SM. C-terminal-binding protein corepresses epithelial and proapoptotic gene expression programs. Proc Natl Acad Sci USA. 2003;100:4568–4573. - PMC - PubMed
    1. Chinnadurai G. CtBP, an unconventional transcriptional corepressor in development and oncogenesis. Mol Cell. 2002;9:213–224. - PubMed
    1. Schaeper U, Boyd JM, Verma S, Uhlmann E, Subramanian T, Chinnadurai G. Molecular cloning and characterization of a cellular phosphoprotein that interacts with a conserved C-terminal domain of adenovirus E1A involved in negative modulation of oncogenic transformation. Proc Natl Acad Sci USA. 1995;92:10467–10471. - PMC - PubMed
    1. Kumar V, Carlson JE, Ohgi KA, Edwards TA, Rose DW, Escalante CR, Rosenfeld MG, Aggarwal AK. Transcription corepressor CtBP is an NAD+-regulated dehydrogenase. Mol Cell. 2002;10:857–869. - PubMed
    1. Balasubramanian P, Zhao LJ, Chinnadurai G. Nicotinamide adenine dinucleotide stimulates oligomerization, interaction with adenovirus E1A and an intrinsic dehydrogenase activity of CtBP. FEBS Lett. 2003;537:157–160. - PubMed

Publication types

MeSH terms