. 2012 Oct 22:3:91.
doi: 10.3389/fpsyt.2012.00091. eCollection 2012.

Inter-Individual Variation during Transcranial Direct Current Stimulation and Normalization of Dose Using MRI-Derived Computational Models

Affiliations

Inter-Individual Variation during Transcranial Direct Current Stimulation and Normalization of Dose Using MRI-Derived Computational Models

Abhishek Datta et al. Front Psychiatry. .

Abstract

Background: Transcranial Direct Current Stimulation (tDCS) is a non-invasive, versatile, and safe neuromodulation technology under investigation for the treatment of neuropsychiatric disorders, adjunct to rehabilitation, and cognitive enhancement in healthy adults. Despite promising results, there is variability in responsiveness. One potential source of variability is the intensity of current delivered to the brain which is a function of both the operator controlled tDCS dose (electrode montage and total applied current) and subject specific anatomy. We are interested in both the scale of this variability across anatomical typical adults and methods to normalize inter-individual variation by customizing tDCS dose. Computational FEM simulations are a standard technique to predict brain current flow during tDCS and can be based on subject specific anatomical MRI.

Objective: To investigate this variability, we modeled multiple tDCS montages across three adults (ages 34-41, one female).

Results: Conventional pad stimulation led to diffuse modulation with maximum current flow between the pads across all subjects. There was high current flow directly under the pad for one subject while the location of peak induced cortical current flow was variable. The High-Definition tDCS montage led to current flow restricted to within the ring perimeter across all subjects. The current flow profile across all subjects and montages was influenced by details in cortical gyri/sulci.

Conclusion: This data suggests that subject specific modeling can facilitate consistent and more efficacious tDCS.

Keywords: HD-tDCS; TMS; head model; tACS; tDCS; transcranial electrical stimulation.


Figures

Figure 1
Figure 1
Segmentation masks. Subject specific tissue masks of the three subjects used in the study. Skin, skull, CSF, gray matter, and white matter are shown. The traditional sponge and the 4 × 1-HD montage for each of the subjects are also shown. For the sponge montage, the anode (positive) electrode is placed over left M1 and the cathode (negative) electrode over the contralateral-supraorbita. For the 4 × 1-HD montage, the anode electrode is placed over left M1 and is surrounded by four cathode electrodes. Red: anode (positive) electrode and Black: cathode (negative) electrode.
Figure 2
Figure 2
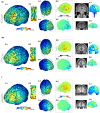
Brain modulation across subjects (M1, M2, F) using conventional pad configuration. For each subject we plotted the induced cortical surface electric field (EF) magnitude: left side view (A.1,B.1,C.1); top view (A.3,B.3,C.3); and right side view (A.4,B.4,C.4). The motor cortex is expanded and scaled to 80% of the peak induced EF for each of the subjects to better highlight current flow (A.2,B.2,C.2). The boxed images show the directional plots (A.5,A.6,B.5,B.6,C.5,C.6). Sample cross-section EF magnitude plots were taken for the frontal and the motor regions. The corresponding MRI scan collected for the subject and the cross-section plots are shown juxtaposed to each other (A.7,A.8,B.7,B.8,C.7,C.8).
Figure 3
Figure 3
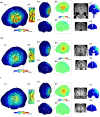
Brain modulation across subjects (M1, M2, F) using high-definition 4 × 1 configuration. For each subject we plotted the induced cortical surface electric field (EF) magnitude: left side view (A.1,B.1,C.1); top view (A.3,B.3,C.3); and right side view (A.4,B.4,C.4). The motor cortex is expanded and scaled to 90% of the peak induced EF for each of the subjects to better highlight current flow (A.2,B.2,C.2). The boxed images show the directional plots (A.5,A.6,B.5,B.6,C.5,C.6). Sample cross-section EF magnitude plots were taken for the frontal and the motor regions. The corresponding MRI scan collected for the subject and the cross-section plots are shown juxtaposed to each other (A.7,A.8,B.7,B.8,C.7,C.8).

References

    1. Antal A., Kincses T. Z., Nitsche M. A., Bartfai O., Paulus W. (2004). Excitability changes induced in the human primary visual cortex by transcranial direct current stimulation: direct electrophysiological evidence. Invest. Ophthalmol. Vis. Sci. 45, 702–70710.1167/iovs.03-0688 - DOI - PubMed
    1. Ashburner J. (2009). Computational anatomy with the SPM software. Magn. Reson. Imaging 27, 1163–117410.1016/j.mri.2009.01.006 - DOI - PubMed
    1. Baker J. M., Rorden C., Fridriksson J. (2010). Using transcranial direct-current stimulation to treat stroke patients with aphasia. Stroke 41, 1229–123610.1161/STROKEAHA.110.594317 - DOI - PMC - PubMed
    1. Bikson M., Bulow P., Stiller J. W., Datta A., Battaglia F., Karnup S. V., et al. (2008). Transcranial direct current stimulation for major depression:a general system for quantifying transcranial electrotherapy dosage. Curr. Treat. Options Neurol. 10, 377–38510.1007/s11940-008-0040-y - DOI - PubMed
    1. Bikson M., Datta A. (2012). Guidelines for precise and accurate computational models of tDCS. Brain Stimul. 5, 430–43110.1016/j.brs.2011.06.001 - DOI - PubMed