. 2012:2012:818925.
doi: 10.1155/2012/818925. Epub 2012 Oct 14.

Respiratory Consequences of Mild-to-Moderate Obesity: Impact on Exercise Performance in Health and in Chronic Obstructive Pulmonary Disease

Affiliations

Respiratory Consequences of Mild-to-Moderate Obesity: Impact on Exercise Performance in Health and in Chronic Obstructive Pulmonary Disease

Denis E O'Donnell et al. Pulm Med. 2012.

Abstract

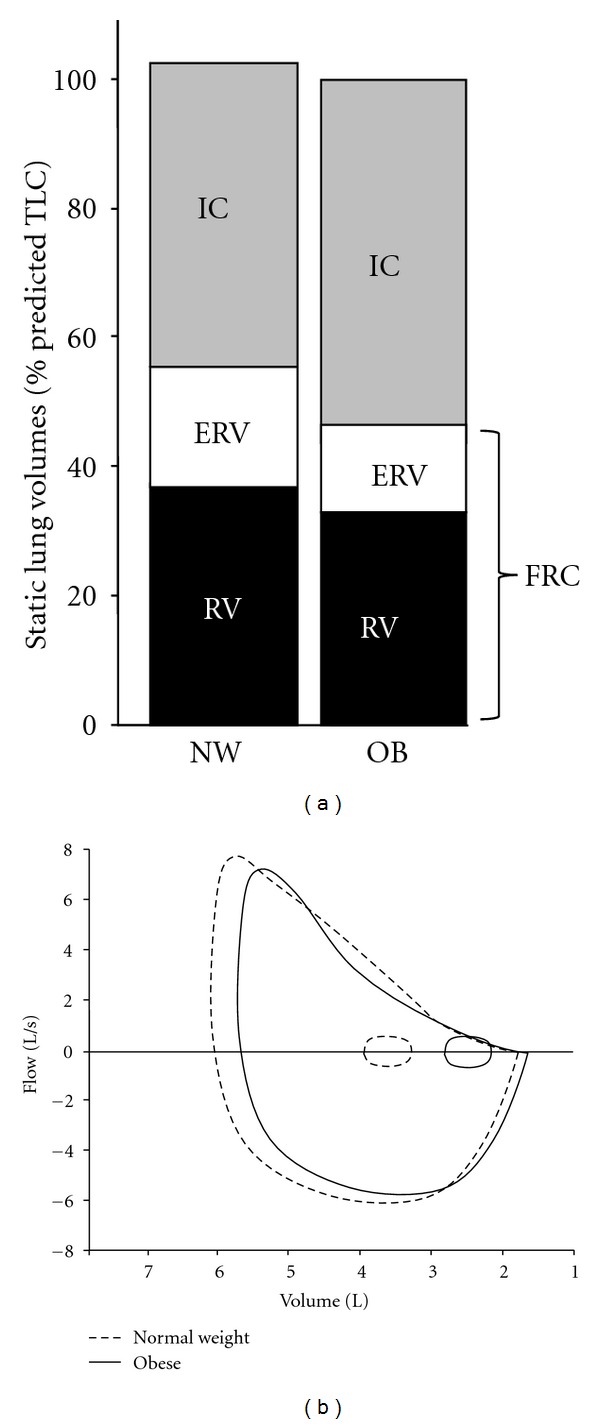
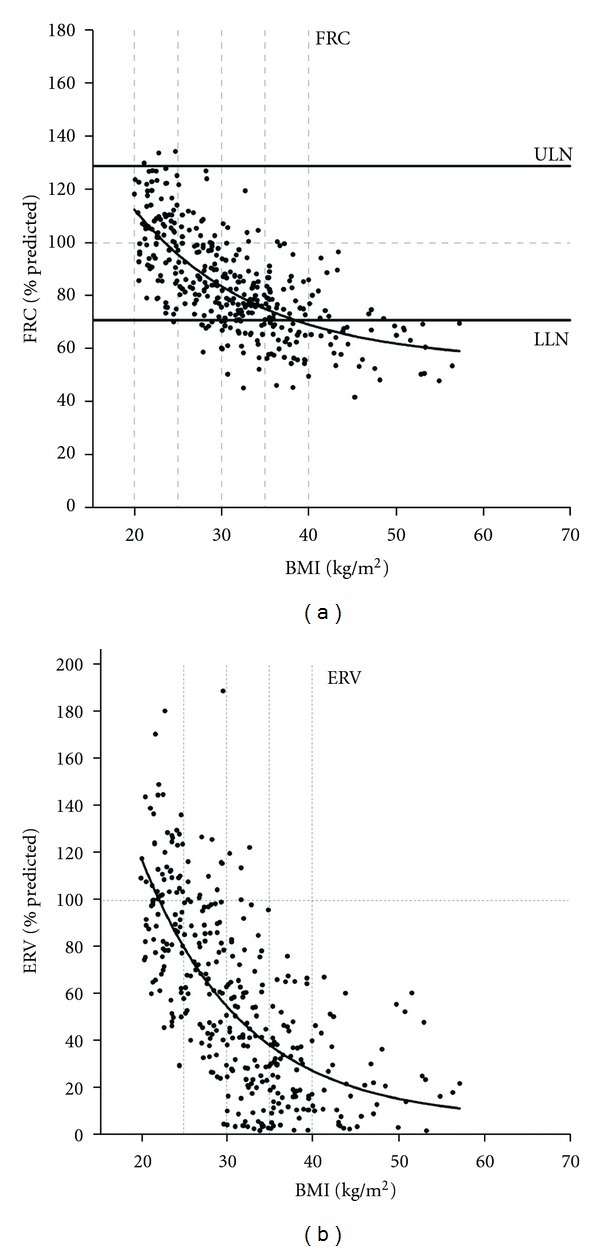
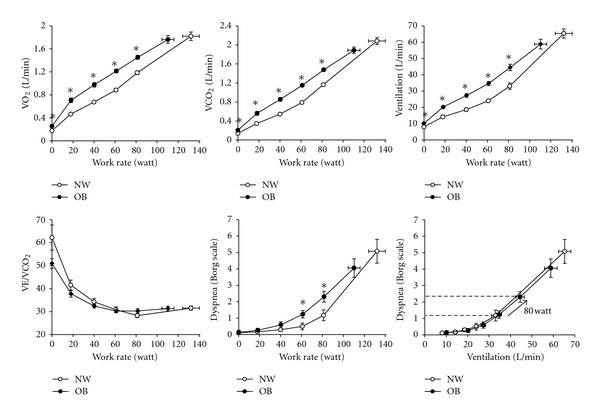
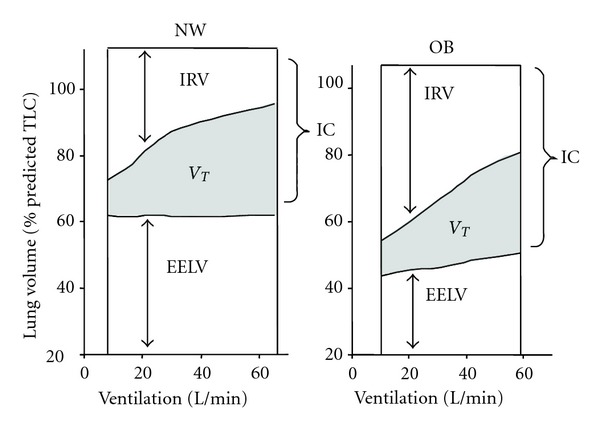
In many parts of the world, the prevalence of obesity is increasing at an alarming rate. The association between obesity, multiple comorbidities, and increased mortality is now firmly established in many epidemiological studies. However, the link between obesity and exercise intolerance is less well studied and is the focus of this paper. Although exercise limitation is likely to be multifactorial in obesity, it is widely believed that the respiratory mechanical constraints and the attendant dyspnea are important contributors. In this paper, we examined the evidence that critical ventilatory constraint is a proximate source of exercise limitation in individuals with mild-to-moderate obesity. We first reviewed existing information on exercise performance, including ventilatory and perceptual response patterns, in obese individuals who are otherwise healthy. We then considered the impact of obesity in patients with preexisting respiratory mechanical abnormalities due to chronic obstructive pulmonary disease (COPD), with particular reference to the effect on dyspnea and exercise performance. Our main conclusion, based on the existing and rather sparse literature on the subject, is that abnormalities of dynamic respiratory mechanics are not likely to be the dominant source of dyspnea and exercise intolerance in otherwise healthy individuals or in patients with COPD with mild-to-moderate obesity.


Figures

Figure 1
Figure 1
(a) Static lung volumes measured by body plethysmography are shown at rest: expiratory reserve volume (ERV) and functional residual capacity (FRC) are decreased, and inspiratory capacity (IC) is increased in the obese (OB) group compared with the normal weight (NW) group of healthy adults. (b) Maximal and tidal flow-volume loops are shown at rest in normal weight (dashed lines) and obese (solid lines) subjects. In obesity, tidal flow-volume loops are shifted rightwards and maximal midexpiratory flow rates may be reduced resulting in greater expiratory flow limitation during resting breathing. RV: residual volume.
Figure 2
Figure 2
FRC and ERV decreased exponentially with increasing BMI in adult patients with normal airway function (for both regressions, r 2 = 0.49  and  P < 0.0001). The horizontal lines for FRC are the average upper limit of normal (ULN) and lower limit of normal (LLN) for men and women, from Jones and Nzekwu [9].
Figure 3
Figure 3
Oxygen uptake (VO2), carbon dioxide output (VCO2), minute ventilation (V E), the ventilatory equivalent for CO2 (V E/VCO2), and dyspnea intensity are shown to be relative to cycle work rate in normal weight (NW) and obese (OB) women. Relationships between dyspnea intensity and ventilation during exercise were similar in OB and NW, thus, increased dyspnea ratings at a given work rate in OB reflected the higher ventilator requirements at that work rate. Values are means ± SEM. *P < 0.05 OB versus NW at a given work rate. Data from Ofir et al. [11].
Figure 4
Figure 4
Operating lung volumes from rest-to-peak exercise are shown in normal weight (NW) and obese (OB) women. End-expiratory lung volume (EELV) increased by 0.38 L during exercise in OB but did not change in the NW subjects. Inspiratory reserve volume (IRV) was greater at rest and throughout exercise in OB women but was not statistically different at the peak of exercise. TLC: total lung capacity, IC: inspiratory capacity, V T: tidal volume (shaded area), from Ofir et al. [11].
Figure 5
Figure 5
Postbronchodilator lung volume components are shown divided by global initiative for chronic obstructive lung disease (GOLD) stage and BMI. The normal column represents measurements from an age-matched healthy, nonsmoker population. UW: underweight; NW: normal weight; OW: overweight; OB: obese; IC: inspiratory capacity; ERV: expiratory reserve volume; RV: residual volume, from O'Donnell et al. [12].
Figure 6
Figure 6
Oxygen consumption (VO2), ventilation, tidal volume, and breathing frequency (F b) are shown in response to symptom-limited cycle exercise in obese (OB) and normal weight (NW) subjects with COPD. Values are means ± SEM. *P < 0.05 OB versus NW at standardized work rates or at peak exercise, modified from Ora et al. [13].
Figure 7
Figure 7
(a) Static lung volumes measured by body plethysmography are shown at rest. Expiratory reserve volume (ERV) and functional residual capacity (FRC = ERV + RV) were significantly lower in the obese (OB) group compared with the normal weight (NW) group with COPD. (b) Operating lung volumes (mean ± SEM) are shown from rest-to-peak exercise in the OB (closed symbols) and NW (open symbols) subjects: end-expiratory lung volume (EELV) was consistently lower at rest and throughout exercise in OB; the OB group reached an EELV at peak exercise that was similar to that of the NW group at the preexercise resting level. IC: inspiratory capacity; IRV: inspiratory reserve volume; V T: tidal volume (shaded area); RV: residual volume, from Ora et al. [13].
Figure 8
Figure 8
(a) Obese (OB) subjects with COPD (closed symbols) had a rightward shift in the dyspnea/ventilation relationship compared with normal weight (NW) subjects with COPD (open symbols). At an isoventilation (V E) of 25 L/min (vertical line with arrow), dyspnea intensity was 1.2 versus 2.4 Borg units in OB versus NW (*P < 0.01). (b) In both groups, the relationship between dyspnea intensity and inspiratory reserve volume (IRV) (standardized as a % of predicted TLC) were superimposed. At isoV E, OB subjects were on the flatter part of the dyspnea/IRV relation while NW subjects were on the steeper portion of the curve. Values are means ± SEM. From Ora et al. [13].

References

    1. Finucane MM, Stevens GA, Cowan MJ, et al. National, regional, and global trends in body-mass index since 1980: systematic analysis of health examination surveys and epidemiological studies with 960 country-years and 9·1 million participants. The Lancet. 2011;377(9765):557–567. - PMC - PubMed
    1. Wang YC, McPherson K, Marsh T, et al. Health and economic burden of the projected obesity trends in the USA and the UK. The Lancet. 2011;378:815–825. - PubMed
    1. Fontaine KR, Redden DT, Wang C, Westfall AO, Allison DB. Years of life lost due to obesity. Journal of the American Medical Association. 2003;289(2):187–193. - PubMed
    1. de Gonzalez AB, Hartge P, Cerhan JR, et al. Body-mass index and mortality among 1.46 million white adults. The New England Journal of Medicine. 2010;363(23):2211–2219. - PMC - PubMed
    1. Martínez-González MÁ, Martínez JA, Hu FB, Gibney MJ, Kearney J. Physical inactivity, sedentary lifestyle and obesity in the European Union. International Journal of Obesity. 1999;23(11):1192–1201. - PubMed

LinkOut - more resources