
Toll-like receptors expression and interferon-γ production by NK cells in human sepsis

Fernando Souza-Fonseca-Guimaraes et al. Crit Care. .

Abstract

Introduction: During the course of infection, natural killer (NK) cells contribute to innate immunity by producing cytokines, particularly interferon-gamma (IFN-γ). In addition to their beneficial effects against infection, NK cells may play a detrimental role during systemic inflammation, causing lethality during sepsis. Little is known on the immune status of NK cells in patients with systemic inflammatory response syndrome (SIRS) or sepsis in terms of cell surface markers expression and IFN-γ production.

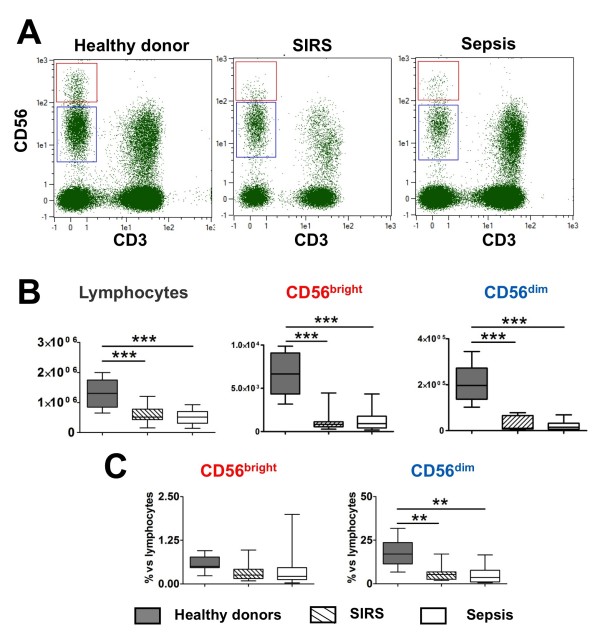
Methods: We investigated 27 sepsis patients and 11 patients with non-infectious SIRS. CD56bright and CD56dim NK cell subsets were identified by flow cytometry and Toll-like receptor (TLR)2, TLR4, TLR9, CX3CR1, CD16 and CD69 expression were analyzed, as well as ex vivo IFN-γ production by NK cells in whole blood samples.

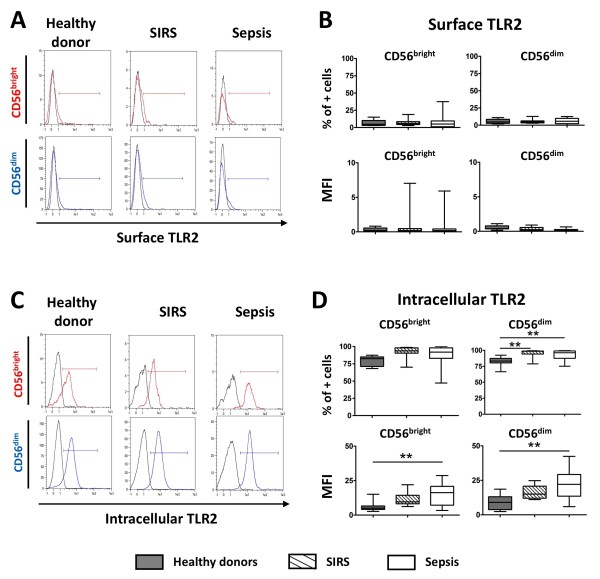
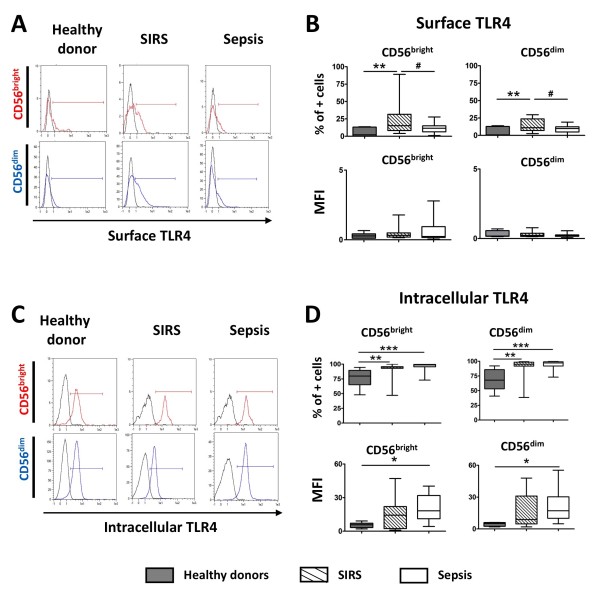
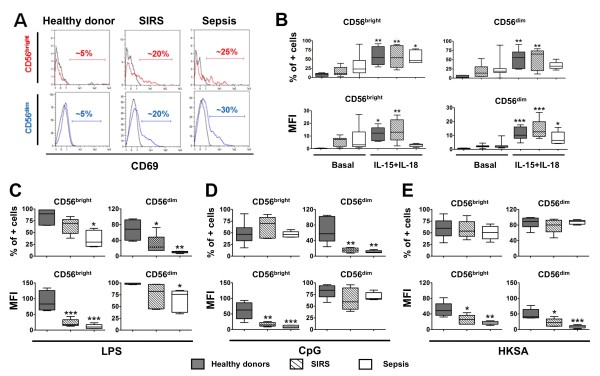
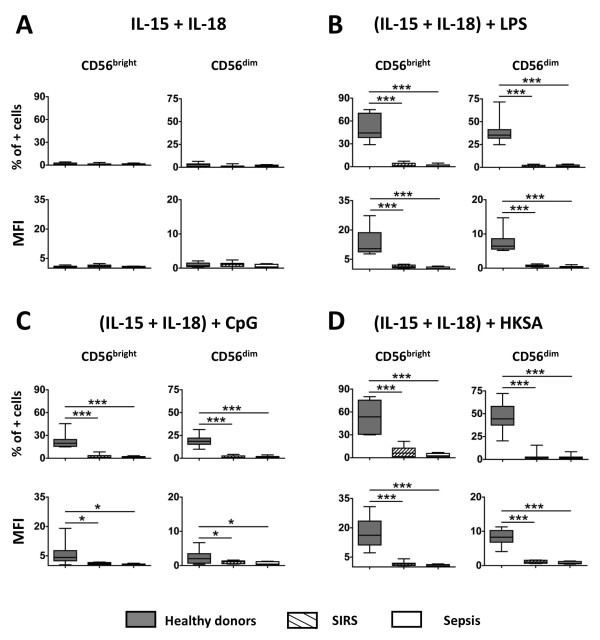
Results: We first showed that in NK cells from healthy controls, TLR2 and TLR4 expression is mainly intracellular, similarly to TLR9. Intracellular levels of TLR2 and TLR4, in both CD56bright and CD56dim NK cell subsets from sepsis patients, were increased compared to healthy subjects. In addition, the percentage of CD69+ cells was higher among NK cells of sepsis patients. No difference was observed for TLR9, CX3CR1, and CD16 expression. The ex vivo stimulation by TLR4 or TLR9 agonists, or whole bacteria in synergy with accessory cytokines (IL-15+IL-18), resulted in significant production of IFN-γ by NK cells of healthy controls. In contrast, for SIRS and sepsis patients this response was dramatically reduced.

Conclusions: This study reports for the first time an intracellular expression of TLR2 and TLR4 in human NK cells. Surface TLR4 expression allows discriminating sepsis and SIRS. Furthermore, during these pathologies, NK cells undergo an alteration of their immune status characterized by a profound reduction of their capacity to release IFN-γ.


Figures

Figure 1
Figure 1
Analysis of NK cells CD56bright and CD56dim subsets in sepsis and systemic inflammatory response syndrome (SIRS) patients. (A) Representative chart of analysis of natural killer (NK) cells in whole blood by flow cytometry. (B) Cell counts for total lymphocytes and NK cell subsets (CD56bright and CD56dim) in healthy volunteers, SIRS, and sepsis patients. (C) Percent of NK subsets among lymphocytes in healthy volunteers, SIRS, and sepsis patients. Data are shown as median and interquartile range. ** P < 0.01; ***P < 0.001.
Figure 2
Figure 2
Analysis of the expression of Toll-like receptor 2 (TLR2) by flow cytometry in natural killer (NK) cell CD56bright and CD56dim subsets. (A) Representative flow cytometry histogram of surface expression of TLR2 on CD56bright and CD56dim NK cell subsets for healthy volunteers, systemic inflammatory response syndrome (SIRS), and sepsis patients. Black line: isotype control; colored line: anti-TLR2. (B) Surface TLR2 expression shown as median and interquartile range in all three studied groups. (C) Representative flow cytometry histogram of intracellular expression of TLR2 for the same samples represented in (A). Black line: isotype control; colored line: anti-TLR2. (D) Intracellular TLR2 expression shown as median and interquartile range in all three studied groups. **P < 0.01 for comparison with healthy controls. MFI, mean fluorescence intensity.
Figure 3
Figure 3
Flow cytometry analysis of Toll-like receptor 4 (TLR4) expression in natural killer (NK) cell CD56bright and CD56dim subsets. (A) Representative flow cytometry histogram of surface expression of TLR4 on CD56bright and CD56dim NK cell subsets for healthy volunteers, systemic inflammatory response syndrome (SIRS), and sepsis patients. Black line: isotype control; colored line: anti-TLR4. (B) Surface TLR4 expression shown as median and interquartile range in all three studied groups. (C) Representative flow cytometry histogram of intracellular expression of TLR4 for the same samples represented in (A). Black line: isotype control; colored line: anti-TLR4. (D) Intracellular TLR4 expression shown as median and interquartile range in all three groups. *P < 0.05; **P < 0.01; ***P < 0.001 for comparison with healthy donors. #P < 0.05 for SIRS versus sepsis patients. MFI, mean fluorescence intensity.
Figure 4
Figure 4
Expression of CD69 on natural killer (NK) cell CD56bright and CD56dim subsets on freshly isolated cells or after in vitro cultures. (A) Representative flow cytometry histograms of surface basal expression of CD69 on CD56bright and CD56dim NK cell subsets for healthy volunteers, systemic inflammatory response syndrome (SIRS), and sepsis patients. Black line: isotype control; colored line: anti-CD69. (B) CD69 expression in all three groups for freshly isolated NK cells (basal) or after overnight culture in the presence of IL-15 + IL-18; data are shown as median and interquartile range. CD69 expression expressed after overnight culture in the presence of IL-15 + IL-18 and lipopolysaccharide (LPS) (C), CpG (D) and heat-killed S. aureus (HKSA) (E); data are expressed as median and interquartile range. *P < 0.05; **P < 0.01; ***P < 0.001 for comparison between healthy donors and patients. MFI, mean fluorescence intensity.
Figure 5
Figure 5
Flow cytometry analysis of IFN-γ secretion in whole blood by CD56bright and CD56dim natural killer (NK) cell subsets after overnight ex vivo stimulation. (A) IL-15 + IL-18; (B) IL-15 + IL-18 + LPS; (C) IL-15 + IL-18 + CpG-DNA; (D) IL-15 + IL-18 + heat-killed S. aureus (HKSA). Median and interquartile range are shown for each group. *P < 0.05; ***P < 0.001 for comparison between healthy donors and patients. MFI, mean fluorescence intensity.

Comment in

References

    1. Cavaillon JM, Adib-Conquy M, Fitting C, Adrie C, Payen D. Cytokine cascade in sepsis. Scand J Infect Dis. 2003;16:535–544. - PubMed
    1. Adib-Conquy M, Cavaillon JM. Compensatory anti-inflammatory response syndrome. Thromb Haemost. 2009;16:36–47. - PubMed
    1. Munoz C, Carlet J, Fitting C, Misset B, Bleriot JP, Cavaillon JM. Dysregulation of in vitro cytokine production by monocytes during sepsis. J Clin Invest. 1991;16:1747–1754. - PMC - PubMed
    1. Marie C, Muret J, Fitting C, Losser MR, Payen D, Cavaillon JM. Reduced ex vivo interleukin-8 production by neutrophils in septic and nonseptic systemic inflammatory response syndrome. Blood. 1998;16:3439–3446. - PubMed
    1. Muret J, Marie C, Fitting C, Payen D, Cavaillon JM. Ex vivo T-lymphocyte derived cytokine production in SIRS patients is influenced by experimental procedures. Shock. 2000;16:169–174. - PubMed

Publication types