. 2014 Feb;24(2):328-39.
doi: 10.1093/cercor/bhs311. Epub 2012 Oct 25.

Layer-specific intracortical connectivity revealed with diffusion MRI

Affiliations

Layer-specific intracortical connectivity revealed with diffusion MRI

Christoph W U Leuze et al. Cereb Cortex. 2014 Feb.

Abstract

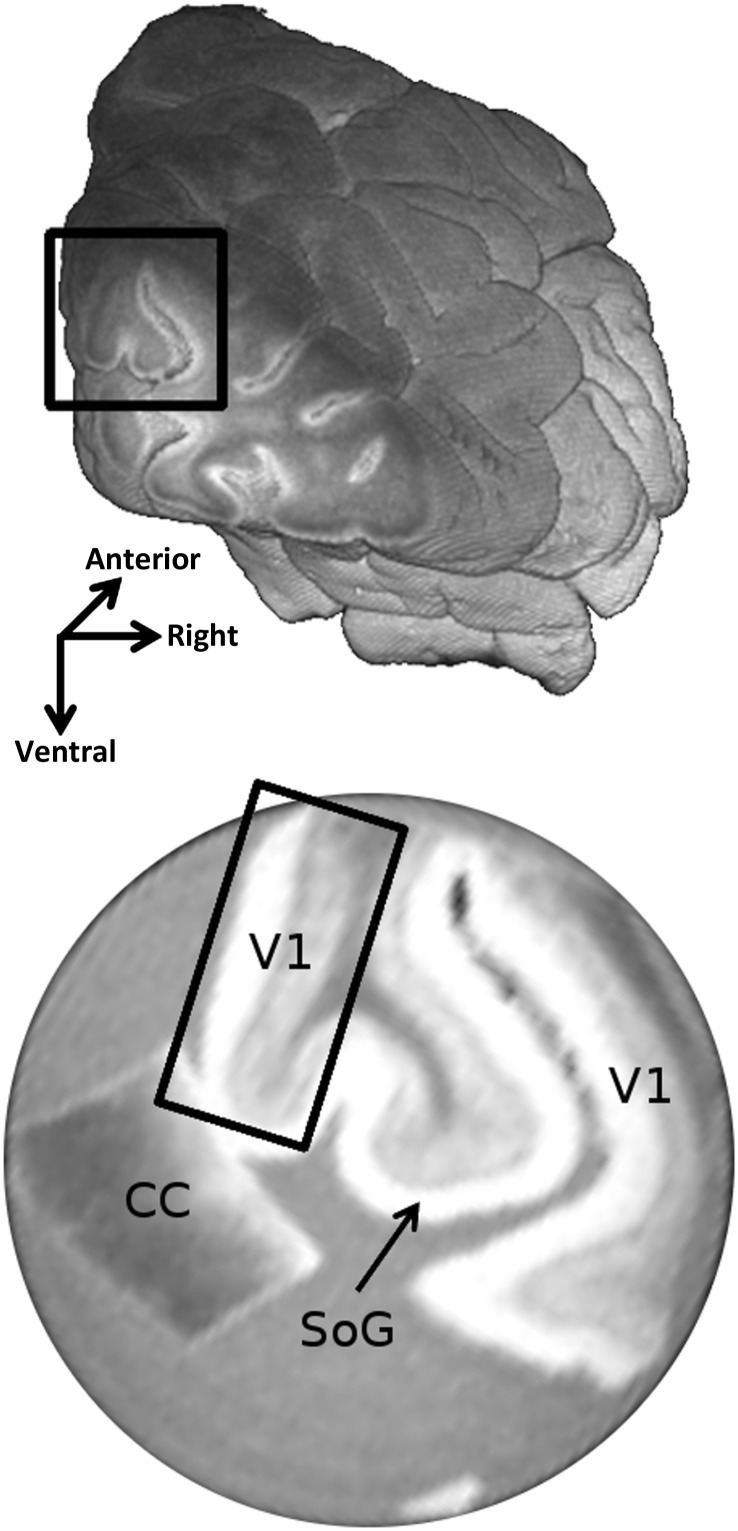
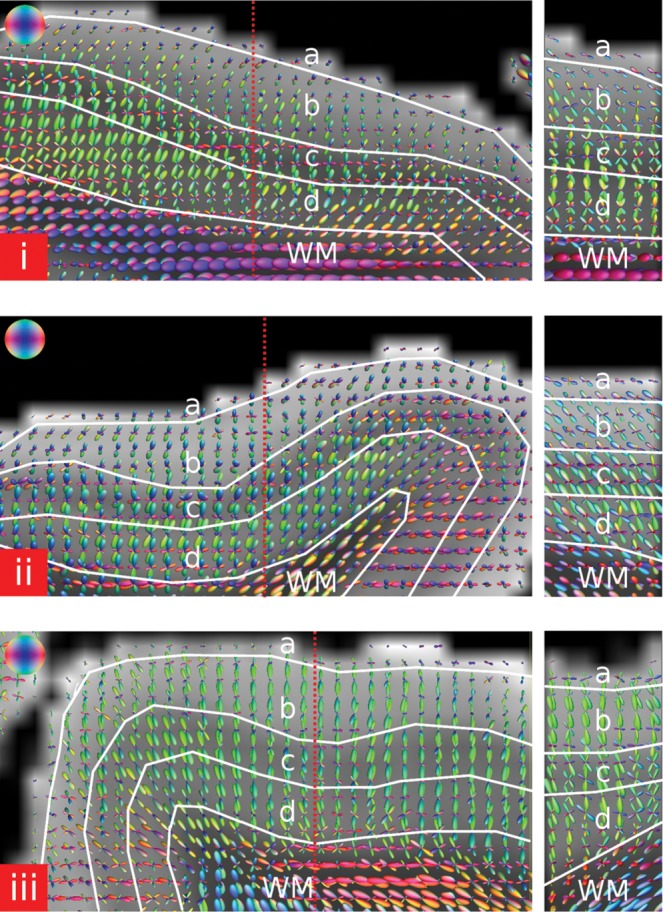
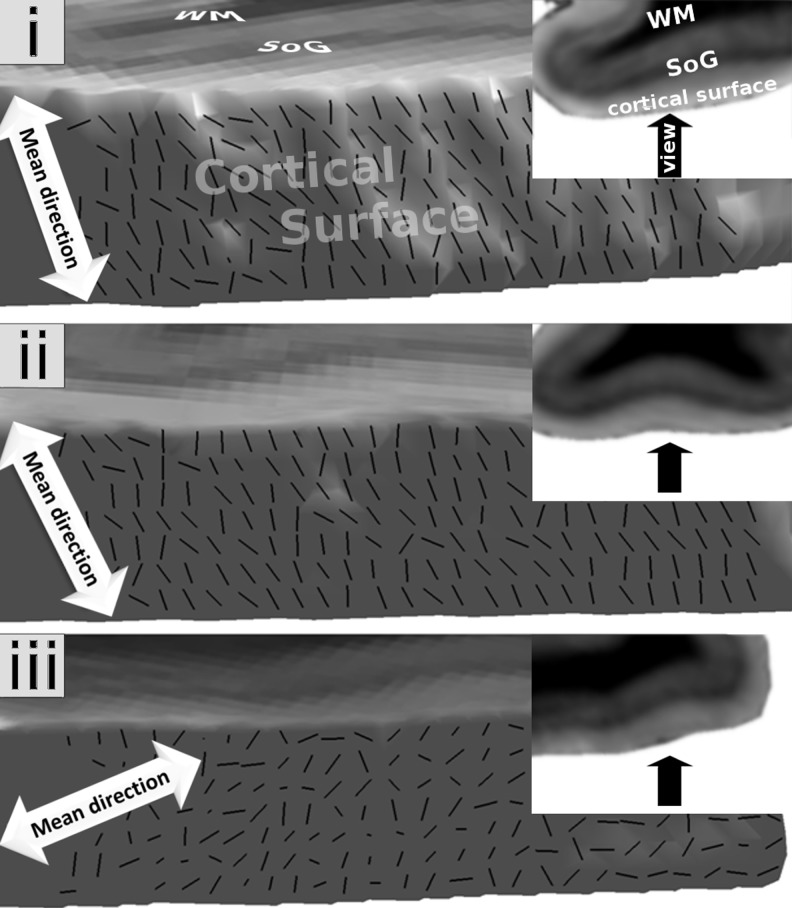
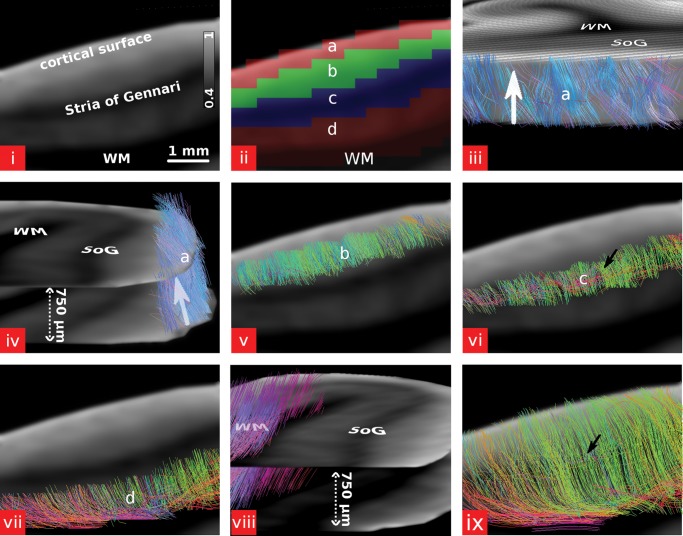
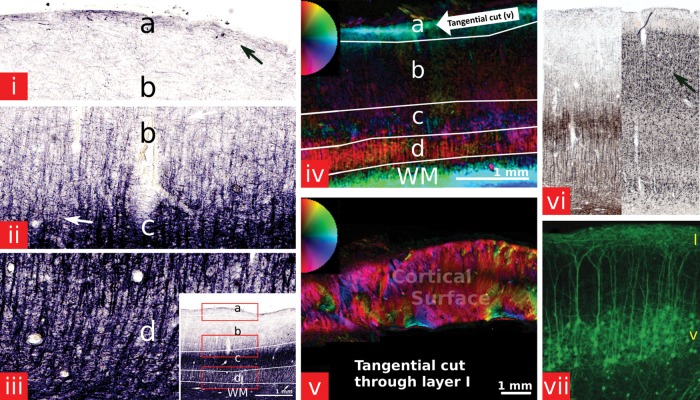
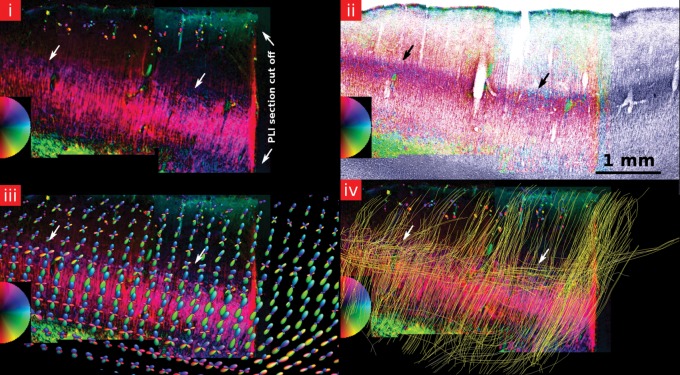
In this work, we show for the first time that the tangential diffusion component is orientationally coherent at the human cortical surface. Using diffusion magnetic resonance imaging (dMRI), we have succeeded in tracking intracortical fiber pathways running tangentially within the cortex. In contrast with histological methods, which reveal little regarding 3-dimensional organization in the human brain, dMRI delivers additional understanding of the layer dependence of the fiber orientation. A postmortem brain block was measured at very high angular and spatial resolution. The dMRI data had adequate resolution to allow analysis of the fiber orientation within 4 notional cortical laminae. We distinguished a lamina at the cortical surface where diffusion was tangential along the surface, a lamina below the surface where diffusion was mainly radial, an internal lamina covering the Stria of Gennari, where both strong radial and tangential diffusion could be observed, and a deep lamina near the white matter, which also showed mainly radial diffusion with a few tangential compartments. The measurement of the organization of the tangential diffusion component revealed a strong orientational coherence at the cortical surface.

Keywords: Stria of Gennari; crossing-fiber tractography; diffusion tensor imaging; layer 1; visual cortex.


Figures

Figure 1.
Figure 1.
(Top) The right occipital lobe with a black box marking the excised brain block. (Bottom) The b = 0 s/mm2 image showing a slice of the sample holder containing a piece of the primary visual cortex (V1) and a piece of the CC. The highly myelinated Stria of Gennari (SoG) is clearly visible inside V1. The black box shows a flat region of the cortex that was used for quantitative analysis.
Figure 2.
Figure 2.
A slice (left) and the corresponding orthogonal slice along the dotted red line (right) showing the fODFs of 3 different brain samples within the primary visual cortex (a–superficial lamina, b—external lamina, c—internal lamina, d—deep lamina). The main direction in the superficial lamina is pointing orthogonal to the slice direction and tangential to the cortical surface. The internal lamina shows strong secondary fODF peaks within many parts of the slice, suggesting more and stronger fiber crossings than in the surrounding regions. Strong secondary peaks can also be observed in the deep lamina near the WM boundary. The colors correspond to the 3D spatial orientation as indicated by the color-coded spheres.
Figure 3.
Figure 3.
The primary fiber direction for 3 brain samples at the cortical surface of the visual cortex and the corresponding mean direction in a top view on the selected region within the brain sample. The arrow in the small image shows the viewing direction on the cortical surface. Orientational coherence could be observed within the superficial laminae of all samples. The strength of the coherence differed between samples. Order Parameters: (i) 0.78, (ii) 0.8, (iii) 0.46.
Figure 4.
Figure 4.
Streamline fiber tracking based on the fODFs was performed for several ROIs covering distinct laminae within the cortex and for the whole cortex in sample 1. (i–ii) The 4 laminae were distinguished based on the MD image (a—superficial lamina, b—external lamina, c—internal lamina, d—deep lamina). The color bar in (i) represents the MD value and has the units ×103 mm2/s. (iii and iv) Fiber tracking restricted to the superficial lamina. The fiber tracts are running tangential within the cortical surface. The viewing angle onto the cortical surface in (iii) is equal as in Figure 3. (iv) Shown are 2 slices out of a stack of 7 slices in order to facilitate visualization of the tangential fiber tracts along the cortical surface. The arrow in (iv) points in the same direction as the arrow in (iii). (v) Fiber tracking restricted to the external lamina. Mainly radial fiber tracts can be observed. (vi) Fiber tracking restricted to the internal lamina. In this region, besides the radial fiber tracts many tangential fiber tracts (arrow) running parallel to the cortical surface can be observed. (vii) Fiber tracking restricted to the deep lamina. Most of the fiber tracts are radial with a few tangential fiber tracts near the WM boundary. Part of the WM was included in the ROI of the deep lamina for better observation of the fiber tracts at the WM boundary. (viii) Fiber tracking restricted to the adjacent WM. Fiber tracts are running tangential to the WM boundary. Same as in (iv) 2 slices out of a stack of 7 slices are shown in order to facilitate the visualization of the tangentiality of the fiber tracts. (ix) Fiber tracking performed in the entire cortex. Within the internal lamina, a few tangentially running fiber tracts (arrow) can be observed. Less tangential fiber tracts in the internal lamina can be observed compared with (vi) since the same number of fiber tracts are computed within a much larger volume and the minimum fiber length for tracking was different. At the cortical surface fiber tracts are running orthogonal to the image plane and tangential to the cortical surface. For a 3D view of the fiber tracts view see online verison of Figure 4. The 3D model was integrated in the PDF of the online version using SimLab Composer (SimLab Soft., Amman, Jordan) and requires the use of a compatible PDF reader (e.g. Adobe Reader 9). Click in the figure to activate the 3D view. In the 3D view, the different laminae are color coded: blue—superficial lamina, green—external lamina, yellow—internal lamina, orange—deep lamina, red—whole cortex, purple—WM.
Figure 5.
Figure 5.
(i–iii) A myelin-stained section in the primary visual cortex of the brain of sample 1 (a—superficial lamina, b—external lamina, c—internal lamina, d—deep lamina). (i–iii) show magnified subregions indicated by the red boxes in the small subfigure at the bottom. Myelinated fibers are extending radially from the WM into the cortex up to the external lamina. Within the cortex, they are crossed by tangentially running fibers with most of the tangentially running myelinated fibers within the Stria of Gennari in the internal lamina (arrow). Within the superficial lamina, myelinated fibers are running horizontally (arrow) along the cortical surface in Exner's stripe. (iv) A polarized light microscopy image of a section within V1 from sample 1. Radial fibers are predominant throughout the deep lamina up to the external lamina. Within the internal lamina, the radial anisotropy of the tissue is decreased (c) due to a large number of tangential crossings. The strong coherence of parallel fibers in the superficial lamina, corresponding to Exner's stripe, can also clearly be observed. The 2D color circle indicates the measured in-plane tissue directions. The color intensity relates to the level of birefringence. (v) A tangential cut along layer 1 (schematic cutting plane indicated by arrow in (iv)) of the brain of sample 2. Large regions of strong fiber coherence can be observed within layer 1. (vi) A Gallyas-stained section showing myelinated axons (left) and the adjacent Merker-stained section marking the cell bodies (right). The cell stain image also shows this radial pattern resulting from the underlying substrate of nerve fibers that are running perpendicular to the cortical surface. The radial pattern is also very strong in the layers II and III (arrow) where not many myelinated axons can be observed. (vii) YFP expression image of the visual cortex (V2) of a mouse. It can be seen how the dendrites extend radially toward layer I where they spread out tangentially along the cortical surface. Reprinted from Demyanenko et al. (2004) with permission from Elsevier.
Figure 6.
Figure 6.
(i) A PLI section of sample 2. The blue stripe indicated by the arrows shows the reduced radiality in the Stria of Gennari. The 2D color circle indicates the measured in-plane tissue directions. The color intensity relates to the level of birefringence. (ii) The myelin stain merged with the PL image confirms that the stripe with reduced radiality coincides with the Stria of Gennari (arrows). (iii) The PLI section with an overlay of the fODF of the same area. The arrows indicates fODF peaks with a strong tangential component near the Stria of Gennari. The color coding of the fODF peaks corresponds to the color-coded sphere in Figure 2. (iv) The same PLI section with an overlay of the fiber tracts seeded in the internal lamina. Radial fiber tracts can be observed throughout the whole cortex. Many tangential fiber tracts follow mainly the internal lamina (arrows) where the birefringence in the PL image is decreased.

References

    1. Amir Y, Harel M, Malach R. Cortical hierarchy reflected in the organization of intrinsic connections in macaque monkey visual cortex. J Comp Neurol. 1993;334:19–46. doi:10.1002/cne.903340103. - DOI - PubMed
    1. Anderson JC, Martin KA. The synaptic connections between cortical areas V1 and V2 in macaque monkey. J Neurosci. 2009;29:11283–11293. doi:10.1523/JNEUROSCI.5757-08.2009. - DOI - PMC - PubMed
    1. Anwander A, Pampel A, Knösche TR. In vivo measurement of cortical anisotropy by diffusion-weighted imaging correlates with cortex type. 2010 Proceedings of the 18th Annual Meeting of ISMRM; 2010 May 1–7; Stockholm (Sweden). p. 109.
    1. Axer H, Axer M, Krings T, Keyserlingk DG. Quantitative estimation of 3-D fiber course in gross histological sections of the human brain using polarized light. J Neurosci Methods. 2001;105:121–131. doi:10.1016/S0165-0270(00)00349-6. - DOI - PubMed
    1. Axer M, Amunts K, Grassel D, Palm C, Dammers J, Axer H, Pietrzyk U, Zilles K. A novel approach to the human connectome: ultra-high resolution mapping of fiber tracts in the brain. Neuroimage. 2011;54:1091–1101. doi:10.1016/j.neuroimage.2010.08.075. - DOI - PubMed

Publication types