. 2013 Feb;109(3):889-99.
doi: 10.1152/jn.00194.2012. Epub 2012 Oct 24.

Effects of cortical feedback on the spatial properties of relay cells in the lateral geniculate nucleus

Affiliations

Effects of cortical feedback on the spatial properties of relay cells in the lateral geniculate nucleus

Ian M Andolina et al. J Neurophysiol. 2013 Feb.

Abstract

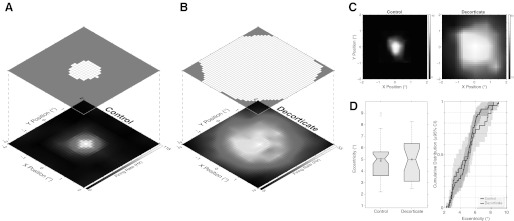
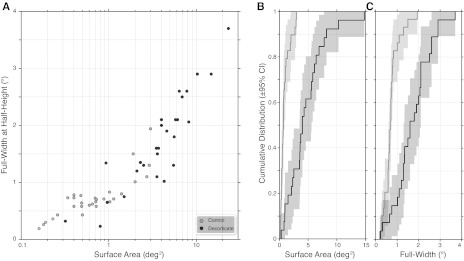
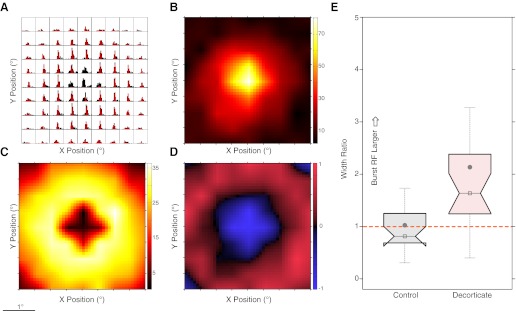
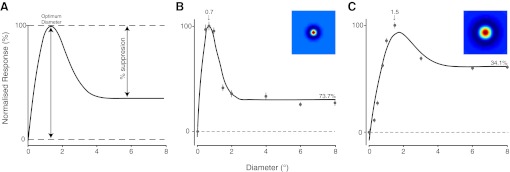
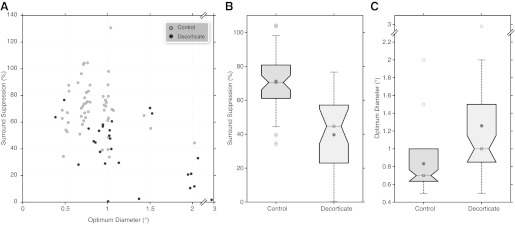
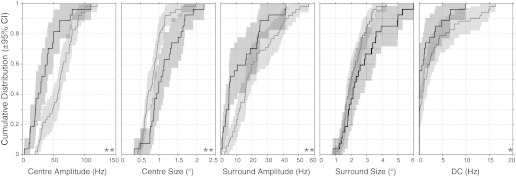
Feedback connections to early-level sensory neurons have been shown to affect many characteristics of their neural response. Because selectivity for stimulus size is a fundamental property of visual neurons, we examined the summation tuning and discretely mapped receptive field (RF) properties of cells in the lateral geniculate nucleus (LGN) both with and without feedback from visual cortex. Using extracellular recording in halothane-anesthetized cats, we used small luminance probes displaced in Cartesian coordinates to measure discrete response area, and optimal sinusoidal gratings of varying diameter to estimate preferred optimal summation size and level of center-surround antagonism. In conditions where most cortical feedback was pharmacologically removed, discretely mapped RF response areas showed an overall significant enlargement for the population compared with control conditions. A switch to increased levels of burst firing, spatially displaced from the RF center, suggested this was mediated by changes in excitatory-inhibitory balance across visual space. With the use of coextensive stimulation, there were overall highly significant increases in the optimal summation size and reduction of surround antagonism with removal of cortical feedback in the LGN. When fitted with a difference-of-Gaussian (DOG) model, changes in the center size, center amplitude, and surround amplitude parameters were most significantly related to the removal of cortical feedback. In summary, corticothalamic innervation of the visual thalamus can modify spatial summation properties in LGN relay cells, an effect most parsimoniously explained by changes in the excitatory-inhibitory balance.


Figures

Fig. 1.
Fig. 1.
Example lateral geniculate nucleus (LGN) cell receptive field (RF) maps ±2° in 0.5° steps. A: control example Y-ON cell (5.6° eccentricity). B: decorticate example X-ON cell (3° eccentricity). A and B are plotted as both firing rate surface plots (bottom) and overlying significant response area surface plots (top). Grayscale bars represent firing rate in Hz. The area measurements are 1.4 deg2 for the control data in A and 14.8 deg2 for the decorticate example in B. C: second example pair of control (X-ON cell; 5.4° eccentricity; 0.88-deg2 area, mapped at ±1° and plotted on a ±2° axis) and decorticate (X-ON cell; 4.3° eccentricity; 10.3-deg2 area, mapped at ±2°) LGN cells. Grayscale bars represent firing rate in Hz. D: box-notch plot (left) and cumulative distribution function (CDF) plot (right) of eccentricity for control and decorticate populations. Gray filled circles indicate mean; open box/horizontal line indicate median. Notch limits signify the 95% confidence interval (CI) of the median; box limits signify 25th and 75th percentiles of the data. Shaded areas plot the 95% CI of the CDF.
Fig. 2.
Fig. 2.
A: scatter plots for surface area (log x-axis) against full width at half-height (linear y-axis) for control (gray) and decorticate (black) LGN cells. B and C: CDF plots for surface area (B) and full width at half-height measurements (C). Shaded areas plot the 95% CI of the CDF.
Fig. 3.
Fig. 3.
Decorticate burst-tonic differences across visual space. A: peristimulus time histograms (PSTH), each position representing steps of 0.5° across visual space, with red-to-black ratio showing the proportion of burst to tonic spikes for each bin. Y-axis maximum = 280 Hz. B: response surface for tonic spikes alone. Color bar represents firing rate in Hz. C: response surface for burst spikes alone. Color bar represents firing rate in Hz. D: normalized burst-tonic surface where −1 (blue) is tonic spikes only and + 1 (red) is burst spikes only. E: population box-notch plots of the width (Gaussian σ) ratio derived from burst-tonic RF fits. Gray filled circle, mean; open box/horizontal line, median. Notch limits signify the 95% CI of the median; box limits signify 25th and 75th percentiles of the data. Dashed orange line signifies unity (no difference between tonic and burst).
Fig. 4.
Fig. 4.
A: schematic of the tuning curve measurements used to quantify the grating summation curves. B: responses of an example X-ON cell with feedback (5.2° eccentricity). Data points are plotted ±SE. The optimal difference-of-Gaussian (DOG) model tuning curve is also shown. C: responses of an example X-ON cell without feedback (5° eccentricity). Conventions as for B. Inset surfaces in B and C are the resultant RFs calculated from the optimal DOG model parameters of the summation tuning curve fit.
Fig. 5.
Fig. 5.
A: scatter plots for optimum diameter plotted against %suppression for control (gray) and decorticate (black) populations. Optimum diameter and %suppression are also plotted as box plots in B and C, respectively. Gray filled circle, mean; open box/horizontal line, median. Notch limits signify the 95% CI of the median; box limits signify 25th and 75th percentiles of the data.
Fig. 6.
Fig. 6.
CDF plots for control (gray) and decorticate (black) populations along with the 95% CIs (shading) for the principal DOG model parameters. **P < 0.01, *P < 0.05, significant population difference between control and decorticate cells.

References

    1. Alitto HJ, Usrey WM. Origin and dynamics of extraclassical suppression in the lateral geniculate nucleus of the macaque monkey. Neuron 57: 135–146, 2008 - PMC - PubMed
    1. Allen EA, Freeman RD. Dynamic spatial processing originates in early visual pathways. J Neurosci 26: 11763–11774, 2006 - PMC - PubMed
    1. Andolina IM, Jones HE, Wang W, Sillito AM. Corticothalamic feedback enhances stimulus response precision in the visual system. Proc Natl Acad Sci USA 104: 1685–1690, 2007 - PMC - PubMed
    1. Angelucci A, Sainsbury K. Contribution of feedforward thalamic afferents and corticogeniculate feedback to the spatial summation area of macaque V1 and LGN. J Comp Neurol 498: 330–351, 2006 - PubMed
    1. Babadi B, Casti A, Xiao Y, Kaplan E, Paninski L. A generalized linear model of the impact of direct and indirect inputs to the lateral geniculate nucleus. J Vis 10: 22, 2010 - PMC - PubMed

Publication types

LinkOut - more resources