. 2012 Oct 24;32(43):14951-65.
doi: 10.1523/JNEUROSCI.1928-12.2012.

Motor memory is encoded as a gain-field combination of intrinsic and extrinsic action representations

Affiliations

Motor memory is encoded as a gain-field combination of intrinsic and extrinsic action representations

Jordan B Brayanov et al. J Neurosci. .

Abstract

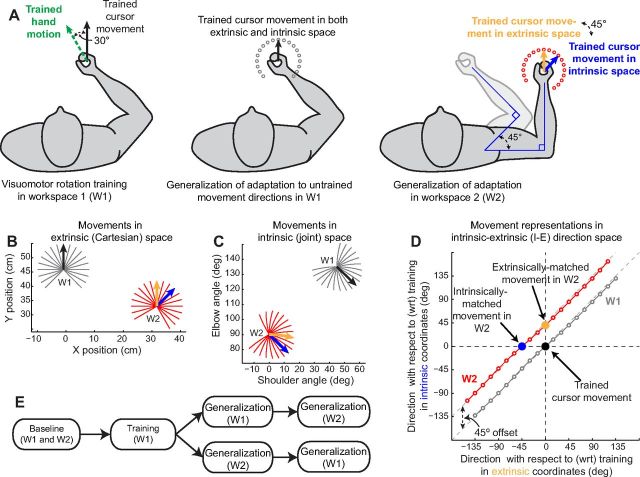
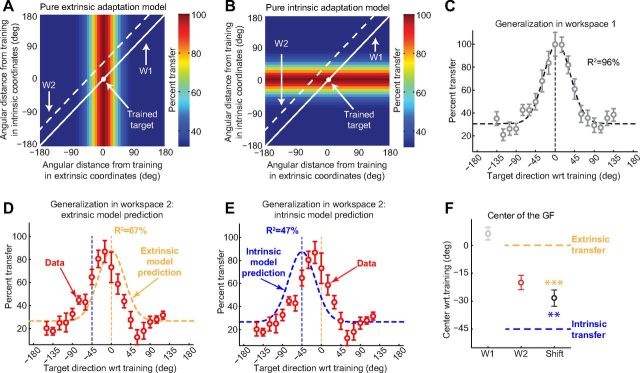
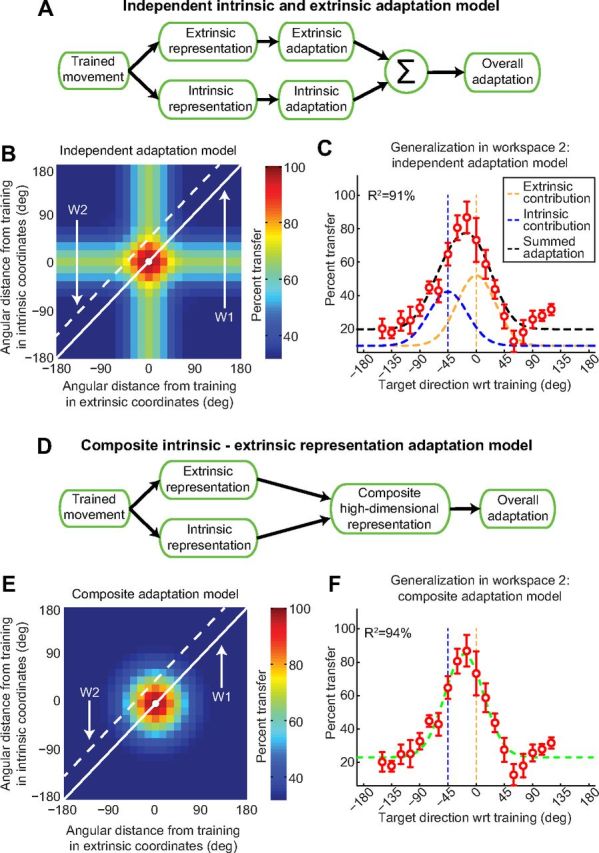
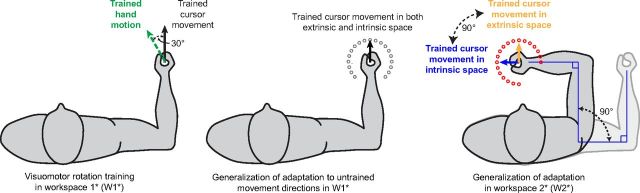
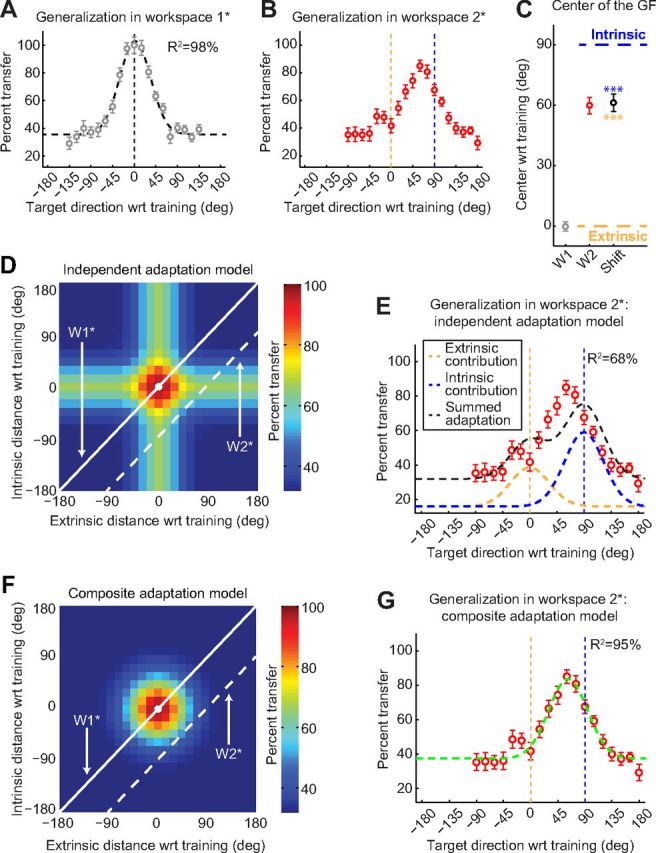
Actions can be planned in either an intrinsic (body-based) reference frame or an extrinsic (world-based) frame, and understanding how the internal representations associated with these frames contribute to the learning of motor actions is a key issue in motor control. We studied the internal representation of this learning in human subjects by analyzing generalization patterns across an array of different movement directions and workspaces after training a visuomotor rotation in a single movement direction in one workspace. This provided a dense sampling of the generalization function across intrinsic and extrinsic reference frames, which allowed us to dissociate intrinsic and extrinsic representations and determine the manner in which they contributed to the motor memory for a trained action. A first experiment showed that the generalization pattern reflected a memory that was intermediate between intrinsic and extrinsic representations. A second experiment showed that this intermediate representation could not arise from separate intrinsic and extrinsic learning. Instead, we find that the representation of learning is based on a gain-field combination of local representations in intrinsic and extrinsic coordinates. This gain-field representation generalizes between actions by effectively computing similarity based on the (Mahalanobis) distance across intrinsic and extrinsic coordinates and is in line with neural recordings showing mixed intrinsic-extrinsic representations in motor and parietal cortices.


Figures

Figure 1.
Figure 1.
Experiment 1 diagram and theoretical framework. A, Task illustration. Left, Subjects adapt to a 30° VMR while reaching to a single target positioned in the 90° direction (trained direction), 9 cm away from the starting point. To move the cursor straight to the trained target (Trained cursor movement, solid black line), subjects need to perform a movement in the 120° direction (Trained hand motion, dashed green line). Middle, After learning the rotation, subjects performed reaching arm movements to an array of 19 probe targets (open gray circles), spaced 15° apart, spanning a range of −135° to +135° with respect to the trained direction in W1. Note that, in W1, the target at the 90° direction is the trained target, and therefore it corresponds to the trained target represented in both intrinsic and extrinsic space. Right, After learning the rotation, subjects also performed reaching arm movements to an array of probe targets (red circles) in W2, also spaced 15° apart. In W2, the extrinsic representation of the trained target is the target at 90° (yellow arrow), whereas the intrinsic representation of the trained target lies in the 45° direction (blue arrow). B, C, Ideal cursor movements to all targets in both workspaces. In B, movements are shown in extrinsic (Cartesian) coordinates, and in C, they are shown in intrinsic (joint) coordinates. In W1 (gray), the black arrow shows the trained cursor movement. In W2 (red), the yellow arrow shows the trained cursor movement in extrinsic space, whereas the blue arrow shows the trained cursor movement in joint space. Note that the black and yellow arrows are parallel in B, indicating that in Cartesian coordinates these two movements require the same position changes, whereas the black and blue arrows are parallel in C, showing that in joint coordinates those two movements require the same joint excursions. D, Target representations in I-E direction space. The x value for each movement is calculated as the distance between that movement and the trained movement in extrinsic coordinates. Similarly, the y value for each movement is calculated as the distance between that movement and the trained one in intrinsic coordinates. The intrinsic and extrinsic displacements from one target to the next are highly correlated within any particular workspace, yielding the nearly linear patterns for W1 and W2 shown in this panel (gray and red traces). E, Experimental protocol. The order of testing in W1 and W2 is randomized such that half the subjects were tested in W1 first (top path) and half were tested in W2 first (bottom path).
Figure 2.
Figure 2.
Single reference frame models. A, B, Pure extrinsic and pure intrinsic adaptation models. The framework used here is the same as the one used in Figure 1D. The trained target is represented as a white dot at the origin (0°, 0°), and the corresponding motor adaptation is scaled to 100% (dark red). W1 and W2 are represented as solid and dashed lines, respectively, and their locations are consistent with Figure 1D. In the extrinsic model, generalization falls off along the extrinsic (x) axis but remains invariant along the intrinsic (y) axis. The intrinsic model (B) makes orthogonal predictions: the generalization is invariant along the extrinsic axis but variable along the intrinsic axis. C–E, Generalization data from W1 and W2. The data from W1 (C) is well approximated by a Gaussian centered at 4.7° with a width (σ) of 30.7° (R2 = 96.3%). The data from W2 is poorly approximated by the extrinsic model prediction (D; R2 = 67.2%) or the intrinsic model prediction (E; R2 = 47.4%). F, Generalization function (GF) centers. In this plot, all values are calculated by fitting Gaussians to individual subject data and averaging the center locations across subjects. In W1, the center is at 6.4°, not significantly different from zero (p > 0.1), whereas the center in W2 is at −19.8°. The shift of the generalization function from W1 to W2 is −28.2° on average, significantly different from −45° and 0° (**p < 0.01; ***p < 0.001).
Figure 3.
Figure 3.
Comparison of two models for motor memory that combine intrinsic and extrinsic representations. A, Diagram of the independent adaptation model. Two representations of the trained movement (intrinsic and extrinsic) adapt independently of each other, and the overall adaptation is simply the sum of the two. B, Predictions from the independent adaptation model in the same format as Figure 2, A and B. As depicted by the plus sign generalization pattern, the trained adaptation retains a non-zero value along both the intrinsic and extrinsic axes. This is a result of the summation of the intrinsic and extrinsic generalization patterns shown in Figure 2, A and B. C, According to the independent adaptation model, the generalization pattern in W2 (black) should be equal to a weighted sum of intrinsic (blue) and extrinsic (orange) components each with a width identical to that observed in W1. This model explains 91.2% of the variance in the W2 data. D, Diagram of the composite gain-field I-E adaptation model. E, Predictions from the composite adaptation model in the same format as B. The generalization pattern has an “island” shape, indicative of a decrease in adaptation away from the trained movement. This arises from a bivariate Gaussian function centered at the origin. F, According to the composite model, the total adaptation (green) should be a single Gaussian with a width equal to that observed in W1 but shifted and scaled. This model explains 94.3% of the variance in the W2 data.
Figure 4.
Figure 4.
Experiment 2 diagram. Subjects adapted to a 30° rotation (left) before generalization was tested in 19 different movement directions in two distinct workspaces (middle and right) as in experiment 1. Note that here the trained workspace (W1*) is the same as the novel workspace (W2) in experiment 1, and the novel workspace in experiment 2 (W2*) is separated from W1* by +90° compared with the −45° separation in experiment 1.
Figure 5.
Figure 5.
Results from the second experiment. A, B, Raw generalization data from experiment 2 in the same format as Figure 2C–E. The generalization data in W1* is well approximated (R2 = 98.0%) by a Gaussian function centered at 2° with a width (σ) of 32.3°, similar to the W1 data from experiment 1. C, Generalization function (GF) centers in the same format as Figure 2E. In W1*, the center is at −0.3°, not significantly different from zero (p > 0.2), whereas in W2*, the center is at 59.9°. The shift of the generalization function from W1* to W2* is 61.2° on average (***p < 0.001). D, E, Predictions from the independent adaptation model. Because the separation between W1* and W2* is greater that between W1 and W2, the model predicts a bimodal generalization function with two distinct peaks at 0° and 90° (white dashed line in D). The sum of intrinsic (blue) and extrinsic (yellow) components (black dashed line in E) is unable to capture the shape of the observed generalization pattern (R2 = 68.3%). Note the substantial contrast between the model fits to the data here and in the first experiment (Fig. 3C), despite an equal number (2) of free parameters. F, G, Predictions from the composite gain-field adaptation model. Regardless of the separation between W1* and W2*, the model predicts a unimodal generalization function (white dashed line in F). The prediction (green dashed line in G) from the composite model explains 94.7% of the variance in the data, very similar to the prediction of this model for the W2 data in experiment 1 (94.3% as shown in Fig. 3F) with the same number of parameters (2) as before.

References

    1. Ahmed AA, Wolpert DM, Flanagan JR. Flexible representations of dynamics are used in object manipulation. Curr Biol. 2008;18:763–768. - PMC - PubMed
    1. Akaike H. New look at statistical-model identification. IEEE T Automat Contr Ac. 1974;19:716–723.
    1. Andersen RA, Mountcastle VB. The influence of the angle of gaze upon the excitability of the light-sensitive neurons of the posterior parietal cortex. J Neurosci. 1983;3:532–548. - PMC - PubMed
    1. Andersen RA, Essick GK, Siegel RM. Encoding of spatial location by posterior parietal neurons. Science. 1985;230:456–458. - PubMed
    1. Andersen RA, Batista AP, Buneo CA, Snyder LH, Cohen YE. Common spatial reference frames for reach and eye movements in posterior parietal cortex. Perception. 1998;27:16. - PubMed

Publication types