. 2012 Oct 24;32(43):14966-78.
doi: 10.1523/JNEUROSCI.2215-12.2012.

Autism-associated mutations in ProSAP2/Shank3 impair synaptic transmission and neurexin-neuroligin-mediated transsynaptic signaling

Affiliations

Autism-associated mutations in ProSAP2/Shank3 impair synaptic transmission and neurexin-neuroligin-mediated transsynaptic signaling

Magali H Arons et al. J Neurosci. .

Abstract

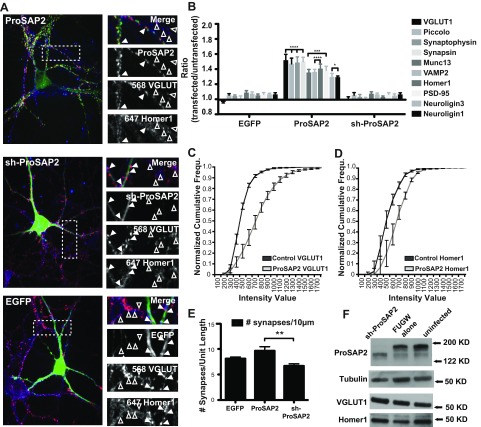
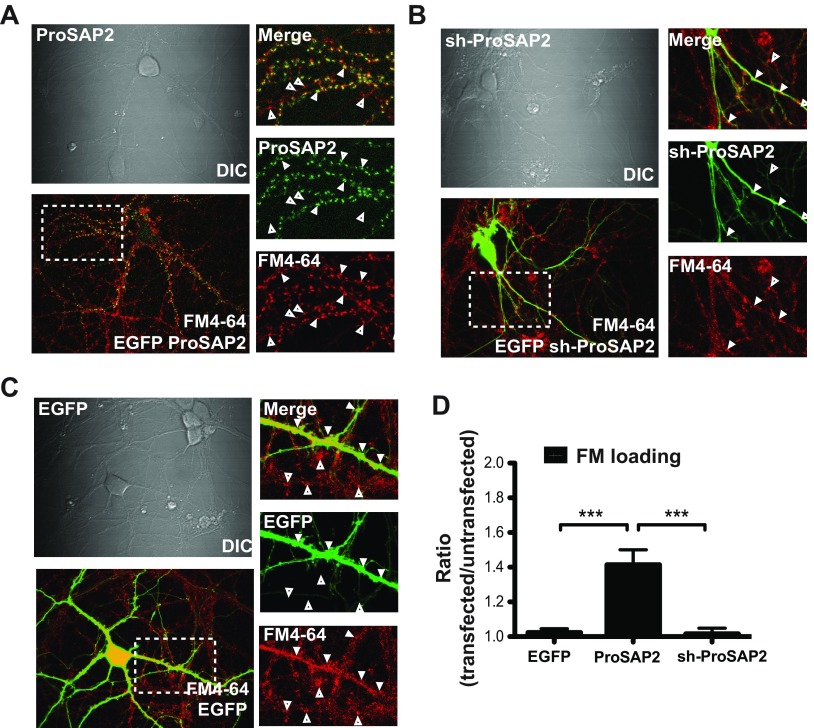
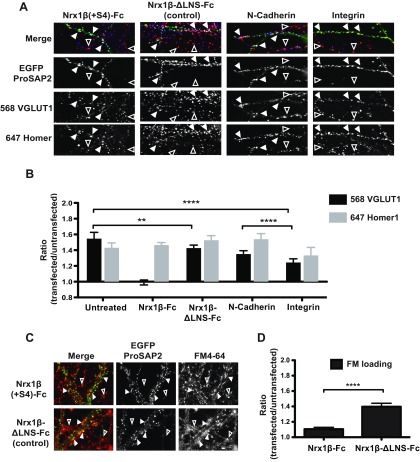
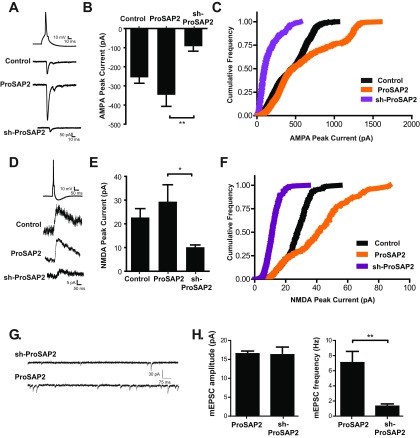
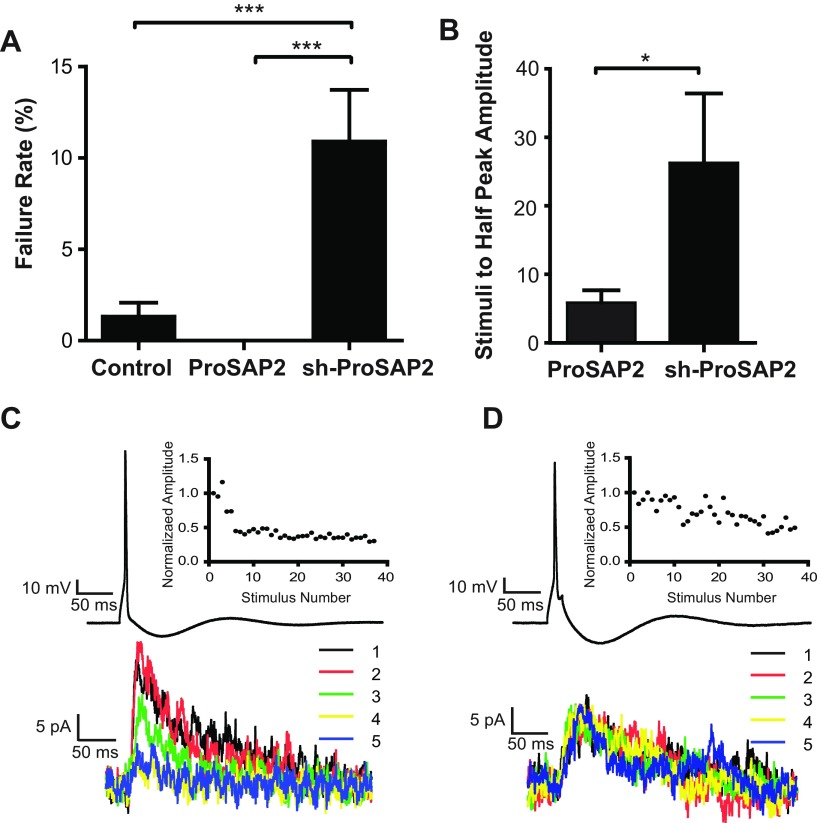
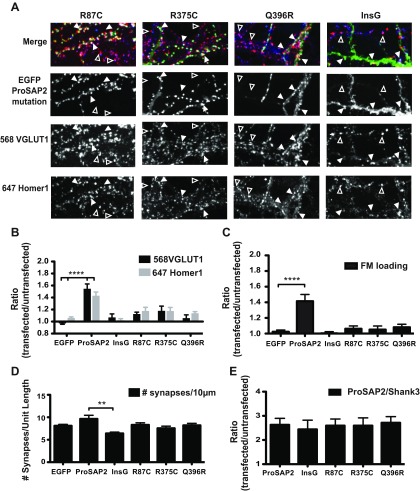
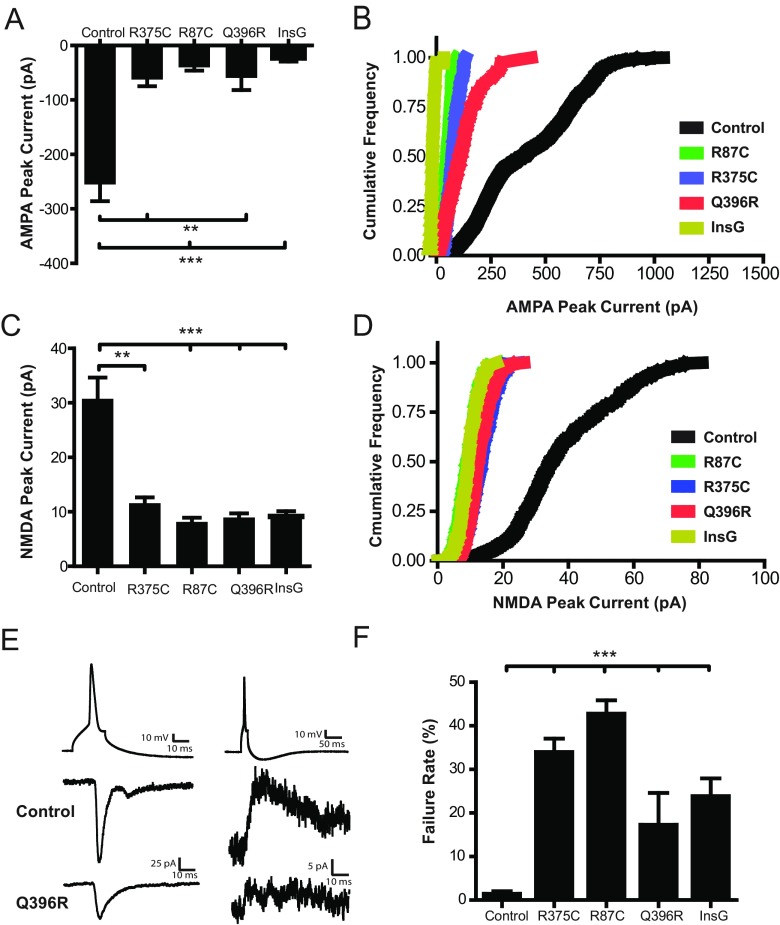
Mutations in several postsynaptic proteins have recently been implicated in the molecular pathogenesis of autism and autism spectrum disorders (ASDs), including Neuroligins, Neurexins, and members of the ProSAP/Shank family, thereby suggesting that these genetic forms of autism may share common synaptic mechanisms. Initial studies of ASD-associated mutations in ProSAP2/Shank3 support a role for this protein in glutamate receptor function and spine morphology, but these synaptic phenotypes are not universally penetrant, indicating that other core facets of ProSAP2/Shank3 function must underlie synaptic deficits in patients with ASDs. In the present study, we have examined whether the ability of ProSAP2/Shank3 to interact with the cytoplasmic tail of Neuroligins functions to coordinate pre/postsynaptic signaling through the Neurexin-Neuroligin signaling complex in hippocampal neurons of Rattus norvegicus. Indeed, we find that synaptic levels of ProSAP2/Shank3 regulate AMPA and NMDA receptor-mediated synaptic transmission and induce widespread changes in the levels of presynaptic and postsynaptic proteins via Neurexin-Neuroligin transsynaptic signaling. ASD-associated mutations in ProSAP2/Shank3 disrupt not only postsynaptic AMPA and NMDA receptor signaling but also interfere with the ability of ProSAP2/Shank3 to signal across the synapse to alter presynaptic structure and function. These data indicate that ASD-associated mutations in a subset of synaptic proteins may target core cellular pathways that coordinate the functional matching and maturation of excitatory synapses in the CNS.


Figures

Figure 1.
Figure 1.
ProSAP2/Shank3 levels mediate transsynaptic changes in synaptic protein content. A, Representative images of hippocampal neurons transfected with pEGFP–αProSAP2 (top), pEGFP/shProSAP2 (middle), or pEGFP (bottom) control on DIV9. Neurons were then fixed at DIV16 and immunostained with antibodies against VGLUT1 (Alexa Fluor 568, shown in red) and Homer1 (Alexa Fluor 647, shown in blue). Filled and open arrowheads mark synapses along dendrites positive or negative for EGFP, respectively. B, Quantification of Alexa Fluor 568–VGLUT1, Alexa Fluor 647–Piccolo, Alexa Fluor 568–Synaptophysin, Alexa Fluor 647–Synapsin, Alexa Fluor 568–Munc13, Alexa Fluor 647–VAMP2, Alexa Fluor 647–Homer1, Alexa Fluor 568–PSD-95, Alexa Fluor 568–NL-1, and Alexa Fluor 568–NL-3 signal intensity at EGFP-positive versus EGFP-negative points using a puncta-by-puncta analysis strategy. Approximately 150–400 puncta were selected and analyzed per image. Ratios of synaptic protein marker values were calculated for EGFP-colocalizing versus non-colocalizing puncta from 7–15 images per condition: presynaptic VGLUT1 (1:55 ratio), Piccolo (1:50 ratio), Synaptophysin (1:51 ratio), Synapsin (1:53 ratio), Munc13 (1:38 ratio), VAMP2 (1:38 ratio), postsynaptic Homer1 (1:43 ratio), PSD-95 (1:41 ratio), NL-1 (1:31 ratio), and NL-3 (1:32 ratio). C, D, Cumulative histograms for VGLUT1 and Homer1 illustrate that the puncta intensity values are shifted across the entire populations of EGFP–αProSAP2 colocalizing versus non-colocalizing puncta. E, Number of synapses per unit length. The number of EGFP-containing synapses containing both presynaptic VGLUT1 and postsynaptic Homer1 along 10 μm of dendrite. F, Western blot showing ProSAP2/Shank3 expression compared with tubulin, VGLUT1, and Homer1 in neurons uninfected (control) or infected with LVs expressing EGFP or EGFP/shProSAP2. FUGW, Flap-Ub promoter-GFP-WRE. *p < 0.05, **p < 0.01, ***p < 0.001, ****p < 0.0001.
Figure 2.
Figure 2.
Transsynaptic changes in protein levels are associated with functional changes, as evidenced by FM4-64. A–C, Representative images of neurons transfected with EGFP–αProSAP2 (A), EGFP/shProSAP2 (B), or EGFP control (C) (green) in which the TRP of SVs was labeled using FM4-64 (red) along with corresponding differential interference contrast (DIC) images. D, Quantification of FM4-64 puncta intensity on neurons transfected with pEGFP–αProSAP2, pEGFP/shProSAP2, or EGFP control cells. Ratios of FM4-64 puncta intensity were calculated by comparing FM4-64 values at EGFP-colocalizing versus non-colocalizing puncta. A significant increase in FM loading is seen in EGFP–αProSAP2-expressing cells (***p < 0.001).
Figure 3.
Figure 3.
Transsynaptic signaling of ProSAP/Shank proteins depends on Neurexin–Neuroligin binding. Several inhibitors against transsynaptic cell-adhesion molecules (Nrx/Nlg, N-cadherin, Integrin) were applied to cells expressing EGFP–αProSAP2 (green) and immunostained with antibodies against presynaptic VGLUT1 (red) and postsynaptic Homer1 (blue). A, Representative images of EGFP–αProSAP2-expressing cells treated with soluble Neurexin-1β(+S4)–Fc [Nrx1β(+S4)-Fc], a β-Nrx control with a mutation in the LNS domain that prevents binding (Nrx1β–ΔLNS–Fc control), N-cadherin antibodies, or a GRGDSP peptide that blocks integrin function. B, Quantification of fluorescent intensities of VGLUT1 and Homer1 at EGFP-colocalizing versus non-colocalizing puncta in cultures treated with GRGDSP, N-cadherin antibodies, or soluble Neurexin-1β. Although the integrin blocking peptide had only a minor effect (**p < 0.01), Nrx1β(+S4)–Fc caused a dramatic reduction in the VGLUT1 (****p < 0.0001). No significant changes in VGLUT1 were seen in N-cadherin or ΔLNS control treatment conditions. C, Changes in the TRP of SVs as measured by FM4-64 loading on neurons transfected with pEGFP–αProSAP2 and treated with the Nrx1β–ΔLNS-Fc control or Nrx1β(+S4)–Fc. Representative images are shown. D, Quantification reveals a dramatic block in the size of the TRP of SV in EGFP–αProSAP2-expressing neurons treated with Nrx1β(+S4)–Fc.
Figure 4.
Figure 4.
ProSAP2/Shank3 levels alter AMPAR and NMDAR-mediated synaptic transmission. A, Example AMPAR-mediated EPSCs from paired recordings between pyramidal neurons in dissociated hippocampal cultures in which the postsynaptic neurons was untransfected (control) or transfected with EGFP–αProSAP2 (middle) or EGFP/shProSAP2 (bottom). One example action potential is shown (top). B, Bar graph of average AMPAR EPSC amplitude in control (n = 34), EGFP–αProSAP2 (n = 24), and EGFP/shProSAP2 (n = 14)-expressing neurons. A significant difference between AMPAR EPSC average amplitude in EGFP–αProSAP2- and EGFP/shProSAP2-expressing neurons was detected by one-way ANOVA (*p < 0.05). C, Cumulative probability plot of the same data in B. The Mann–Whitney U test determined a significant effect of both EGFP–αProSAP2 and EGFP/shProSAP2 on AMPAR EPSC amplitudes (p < 0.001 in both cases). D, Example NMDAR-mediated EPSCs from paired recordings in which the postsynaptic neurons was untransfected (control) or transfected with EGFP–αProSAP2 (middle) or EGFP/shProSAP2 (bottom). One example action potential is shown above. E, Bar graph of the average NMDAR EPSC amplitude in control (n = 18), EGFP–αProSAP2-expressing (n = 14), and EGFP/shProSAP2-expressing (n = 10) neurons. One-way ANOVA determined a significant difference (*p < 0.05) between EGFP–αProSAP2- and EGFP/shProSAP2-expressing neurons. F, Cumulative probability plot of NMDAR EPSC amplitudes from E. The Mann–Whitney U test determined a significant effect of both EGFP–αProSAP2 and EGFP/shProSAP2 on NMDAR EPSC amplitudes (***p < 0.001 in both cases). G, Example mEPSCs from EGFP/shProSAP2-expressing (top) and EGFP–αProSAP2-expressing (bottom) neurons. Calibration: 30 pA, 75 ms. H, Average mEPSC amplitudes (left) and frequency (right) in EGFP–αProSAP2- and EGFP/shProSAP2-expressing neurons, with a significant difference being detected in mEPSC frequency (**p < 0.01).
Figure 5.
Figure 5.
Evidence of presynaptic changes in synapse function with changing postsynaptic ProSAP2/Shank3 levels. A, Average failure rates of AMPAR-mediated EPSCs in control (n = 34), EGFP–αProSAP2-expressing (n = 24), and EGFP/shProSAP2-expressing (n = 14) neurons. No failures were detected in pyramidal cell pairs in which the postsynaptic neuron was overexpressing EGFP–αProSAP2 (***p < 0.001). B, Bar graph of average stimulus number (i.e., presynaptic action potentials) required to decrease the NMDAR amplitude to 50% of its original amplitude in the presence of MK-801 in EGFP–αProSAP2-expressing (n = 6) and EGFP/shProSAP2-expressing (n = 5) neurons (*p < 0.05, determined by two-tailed t test). C, D, Example individual experiments for EGFP–αProSAP2-expressing (C) and EGFP/shProSAP2-expressing (D) neurons. An example action potential is shown for each recording together with the first five postsynaptic NMDAR-mediated traces after the addition of MK-801. The inset plots show the change in NMDAR EPSC amplitude for each example paired recording. Note the rapid decay of the current amplitude in the EGFP–αProSAP-expressing neuron but the slow decay in the EGFP/shProSAP2-expressing neuron.
Figure 6.
Figure 6.
Autism-associated mutations in ProSAP2/Shank3 interfere with transsynaptic signaling. A, Representative images of hippocampal neurons transfected with EGFP–αProSAP2 carrying autism-associated mutations (R87C, R375C, Q396R, and InsG) at DIV9 and subsequently fixed and stained with antibodies against VGLUT1 and Homer1 at DIV16. Arrowheads label VGLUT1 (red) and Homer1 (blue) colocalizing clusters along dendritic profiles of untransfected (open) or EGFP–αProSAP2-positive (green) synaptic puncta (filled). B, Quantification of puncta fluorescent intensity using a puncta-by-puncta analysis that compares signal intensity values between Alexa Fluor 568–VGLUT1 and Alexa Fluor 647–Homer1 puncta that colocalize with EGFP-positive sites and Alexa Fluor 568–VGLUT1 and Alexa Fluor 647–Homer1-only sites (****p < 0.0001). C, Quantification and comparison of the size of the TRP of SVs measured with FM4-64 in neurons expressing wild-type or autism-associated mutations in EGFP–αProSAP2 (R87C, R375C, Q396R, and InsG). Ratios of FM4-64 puncta intensity were calculated by comparing FM4-64 values at EGFP-colocalizing versus non-colocalizing puncta (****p < 0.0001). D, The number of EGFP-positive synapses expressing both presynaptic VGLUT1 and postsynaptic Homer1 per 10 μm of dendrite from neurons transfected with wild-type or autism-associated mutations in EGFP–αProSAP2 (**p < 0.01). E, Synaptic levels of ProSAP2/Shank3 levels in neurons expressing wild-type EGFP–αProSAP2 or autism mutations. Synapses in transfected cells were identified by immunostaining neurons with antibodies against VGLUT1 and ProSAP2/Shank3.
Figure 7.
Figure 7.
Autism-associated mutations in ProSAP2/Shank3 interfere with AMPAR and NMDAR-mediated synaptic transmission. A–D, AMPAR-mediated (A, B) and NMDAR-mediated (C, D) EPSCs measured from hippocampal pyramidal cell pairs in which the postsynaptic neuron is expressing one of the EGFP–αProSAP2 autism-associated mutations (R375C, R87C, Q396R, or InsG). A, Bar graph of average AMPAR EPSC amplitudes in untransfected controls (n = 39), R375C (n = 5), R87C (n = 5), Q396R (n = 6), and InsG (n = 7). Two-tailed t test revealed that all AMPAR EPSC amplitudes in neurons expressing the autism mutations are significantly different from controls (**p < 0.01, ***p < 0.001). B, Cumulative frequency plot of AMPAR EPSC amplitudes in A. The Mann–Whitney U test determined a significant effect of all EGFP–αProSAP2 autism-associated mutations (p < 0.001 in all cases). C, Bar graph of average NMDAR EPSC amplitudes in untransfected controls (n = 11), R375C (n = 5), R87C (n = 5), Q396R (n = 6), and InsG (n = 5). All average NMDAR EPSC amplitudes in neurons expressing the autism mutations are significantly different from controls (*p < 0.05). D, Cumulative frequency plot of NMDAR EPSC amplitudes in C. The Mann–Whitney U test determined a significant effect of all EGFP–αProSAP2 autism-associated mutations (***p < 0.001 in all cases). E, Example AMPAR-mediated (left) and NMDAR-mediated (right) EPSCs from control and EGFP–αProSAP2 Q396R-expressing postsynaptic neurons. F, Average failure rate of AMPAR-mediated EPSCs in control, R375C-expressing, R87C-expressing, Q396R-expressing, and InsG-expressing neurons.

Similar articles

Cited by

References

    1. Bailey A, Phillips W, Rutter M. Autism: towards an integration of clinical, genetic, neuropsychological, and neurobiological perspectives. J Child Psychol Psychiatry. 1996;37:89–126. - PubMed
    1. Bangash MA, Park JM, Melnikova T, Wang D, Jeon SK, Lee D, Syeda S, Kim J, Kouser M, Schwartz J, Cui Y, Zhao X, Speed HE, Kee SE, Tu JC, Hu JH, Petralia RS, Linden DJ, Powell CM, Savonenko A, Xiao B, Worley PF. Enhanced polyubiquitination of Shank3 and NMDA receptor in a mouse model of autism. Cell. 2011;145:758–772. - PMC - PubMed
    1. Berkel S, Marshall CR, Weiss B, Howe J, Roeth R, Moog U, Endris V, Roberts W, Szatmari P, Pinto D, Bonin M, Riess A, Engels H, Sprengel R, Scherer SW, Rappold GA. Mutations in the SHANK2 synaptic scaffolding gene in autism spectrum disorder and mental retardation. Nat Genet. 2010;42:489–491. - PubMed
    1. Boeckers TM, Bockmann J, Kreutz MR, Gundelfinger ED. ProSAP/Shank proteins—a family of higher order organizing molecules of the postsynaptic density with an emerging role in human neurological disease. J Neurochem. 2002;81:903–910. - PubMed
    1. Bourgeron T. A synaptic trek to autism. Curr Opin Neurobiol. 2009;19:231–234. - PubMed

Publication types

MeSH terms