Developmental switch in spike timing-dependent plasticity at layers 4-2/3 in the rodent barrel cortex
- PMID: 23100422
- PMCID: PMC6704840
- DOI: 10.1523/JNEUROSCI.2506-12.2012
Developmental switch in spike timing-dependent plasticity at layers 4-2/3 in the rodent barrel cortex
Abstract
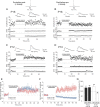
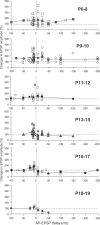
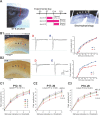
Sensory deprivation during the critical period induces long-lasting changes in cortical maps. In the rodent somatosensory cortex (S1), its precise initiation mechanism is not known, yet spike timing-dependent plasticity (STDP) at layer 4 (L4)-L2/3 synapses are thought to be crucial. Whisker stimulation causes "L4 followed by L2/3" cell firings, while acute single whisker deprivation suddenly reverses the sequential order in L4 and L2/3 neurons in the deprived column (Celikel et al., 2004). Reversed spike sequence then leads to long-term depression through an STDP mechanism (timing-dependent long-term depression), known as deprivation-induced suppression at L4-L2/3 synapses (Bender et al., 2006a), an important first step in the map reorganization. Here we show that STDP properties change dramatically on postnatal day 13-15 (P13-P15) in mice S1. Before P13, timing-dependent long-term potentiation (t-LTP) was predominantly induced regardless of spiking order. The induction of t-LTP required postsynaptic influx of Ca(2+), an activation of protein kinase A, but not calcium/calmodulin-dependent protein kinase II. Consistent with the strong bias toward t-LTP, whisker deprivation (all whiskers in Row "D") from P7-P12 failed to induce synaptic depression at L4-L2/3 synapses in the deprived column, but clear depression was seen if deprivation occurred after P14. Random activation of L4, L2/3 cells, as may occur in response to whisker stimulation before P13 during network formation, led to potentiation under the immature STDP rule, as predicted from the bias toward t-LTP regardless of spiking order. These findings describe a developmental switch in the STDP rule that may underlie the transition from synapse formation to circuit reorganization at L4-L2/3 synapses, both in distinct activity-dependent manners.
Figures


Similar articles
-
Developmental Switch in Spike Timing-Dependent Plasticity and Cannabinoid-Dependent Reorganization of the Thalamocortical Projection in the Barrel Cortex.J Neurosci. 2016 Jun 29;36(26):7039-54. doi: 10.1523/JNEUROSCI.4280-15.2016. J Neurosci. 2016. PMID: 27358460 Free PMC article.
-
Whisker row deprivation affects the flow of sensory information through rat barrel cortex.J Neurophysiol. 2017 Jan 1;117(1):4-17. doi: 10.1152/jn.00289.2016. Epub 2016 Oct 5. J Neurophysiol. 2017. PMID: 27707809 Free PMC article.
-
A Hypothetical Model Concerning How Spike-Timing-Dependent Plasticity Contributes to Neural Circuit Formation and Initiation of the Critical Period in Barrel Cortex.J Neurosci. 2019 May 15;39(20):3784-3791. doi: 10.1523/JNEUROSCI.1684-18.2019. Epub 2019 Mar 15. J Neurosci. 2019. PMID: 30877173 Free PMC article. Review.
-
Modulation of spike timing by sensory deprivation during induction of cortical map plasticity.Nat Neurosci. 2004 May;7(5):534-41. doi: 10.1038/nn1222. Epub 2004 Apr 4. Nat Neurosci. 2004. PMID: 15064767 Free PMC article.
-
The spike-timing dependence of plasticity.Neuron. 2012 Aug 23;75(4):556-71. doi: 10.1016/j.neuron.2012.08.001. Neuron. 2012. PMID: 22920249 Free PMC article. Review.
Cited by
-
Dendritic Spines in Early Postnatal Fragile X Mice Are Insensitive to Novel Sensory Experience.J Neurosci. 2019 Jan 16;39(3):412-419. doi: 10.1523/JNEUROSCI.1734-18.2018. Epub 2018 Dec 6. J Neurosci. 2019. PMID: 30523064 Free PMC article.
-
Activity-Dependent Downscaling of Subthreshold Synaptic Inputs during Slow-Wave-Sleep-like Activity In Vivo.Neuron. 2018 Mar 21;97(6):1244-1252.e5. doi: 10.1016/j.neuron.2018.01.047. Epub 2018 Mar 1. Neuron. 2018. PMID: 29503184 Free PMC article.
-
Interplay between short- and long-term plasticity in cell-assembly formation.PLoS One. 2014 Jul 9;9(7):e101535. doi: 10.1371/journal.pone.0101535. eCollection 2014. PLoS One. 2014. PMID: 25007209 Free PMC article.
-
Distinct mechanisms of spike timing-dependent LTD at vertical and horizontal inputs onto L2/3 pyramidal neurons in mouse barrel cortex.Physiol Rep. 2014 Mar 27;2(3):e00271. doi: 10.1002/phy2.271. Print 2014. Physiol Rep. 2014. PMID: 24760524 Free PMC article.
-
Gestational Chlorpyrifos Exposure Imparts Lasting Alterations to the Rat Somatosensory Cortex.J Neurosci. 2025 Jun 11;45(24):e0363252025. doi: 10.1523/JNEUROSCI.0363-25.2025. J Neurosci. 2025. PMID: 40345837
References
-
- Agmon A, Connors BW. Thalamocortical responses of mouse somatosensory (barrel) cortex in vitro. Neuroscience. 1991;41:365–379. - PubMed
-
- Allen CB, Celikel T, Feldman DE. Long-term depression induced by sensory deprivation during cortical map plasticity in vivo. Nat Neurosci. 2003;6:291–299. - PubMed
-
- Armstrong-James M. The nature and plasticity of sensory processing within adult rat barrel cortex. In: Jones EG, Diamond IT, editors. Cerebral Cortex. New York, London: Plenum; 1995. pp. 333–373.
-
- Armstrong-James M, Fox K, Das-Gupta A. Flow of excitation within rat barrel cortex on striking a single vibrissa. J Neurophysiol. 1992;68:1345–1358. - PubMed
Publication types
MeSH terms
Substances
LinkOut - more resources
Full Text Sources
Research Materials
Miscellaneous
