. 2012 Oct 24;32(43):15036-52.
doi: 10.1523/JNEUROSCI.3326-12.2012.

AKAP150-anchored calcineurin regulates synaptic plasticity by limiting synaptic incorporation of Ca2+-permeable AMPA receptors

Affiliations

AKAP150-anchored calcineurin regulates synaptic plasticity by limiting synaptic incorporation of Ca2+-permeable AMPA receptors

Jennifer L Sanderson et al. J Neurosci. .

Abstract

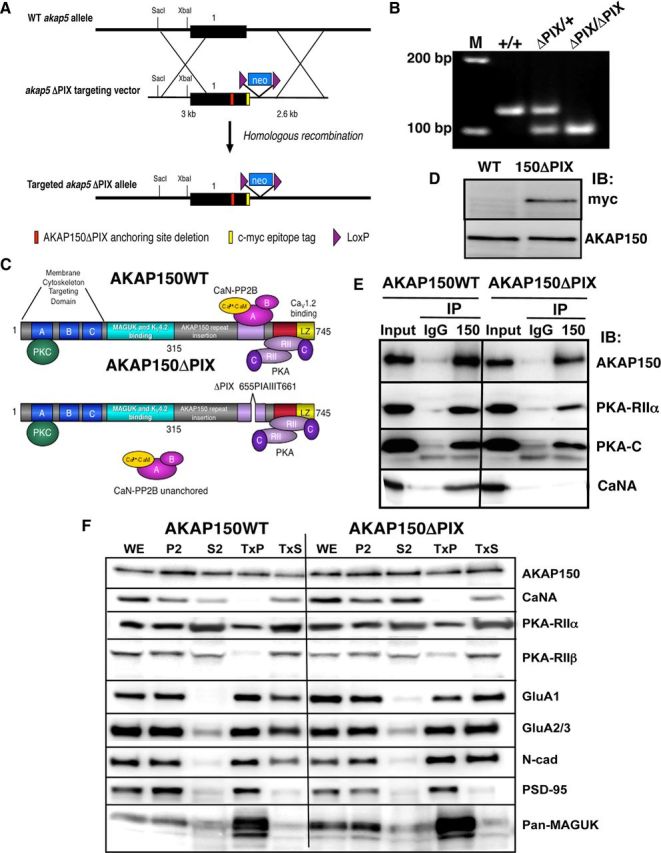
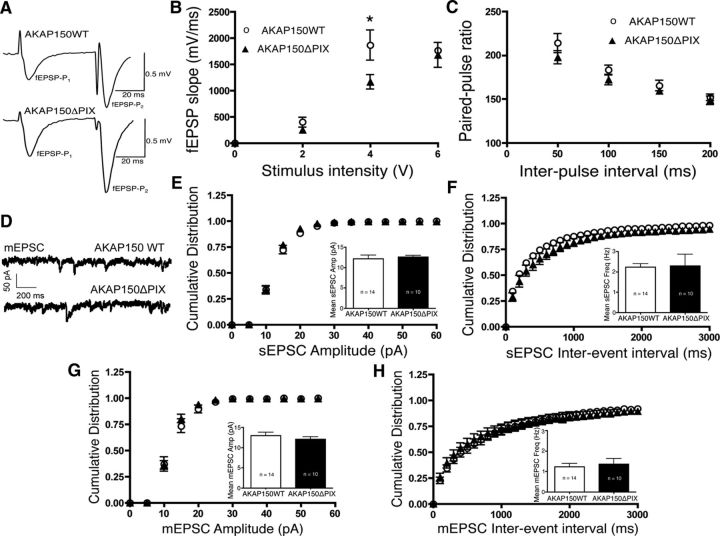
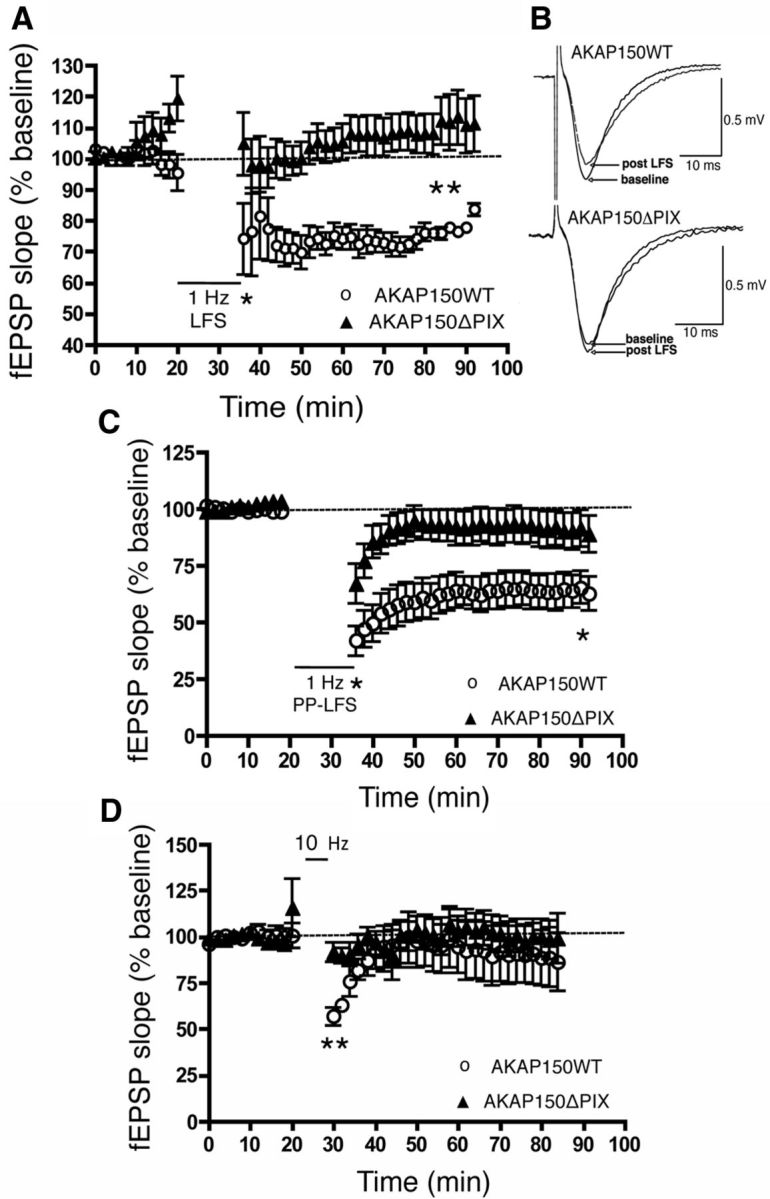
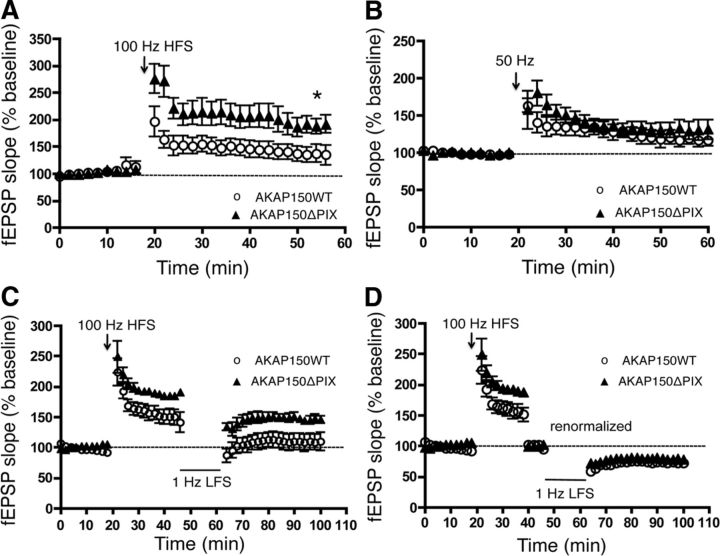
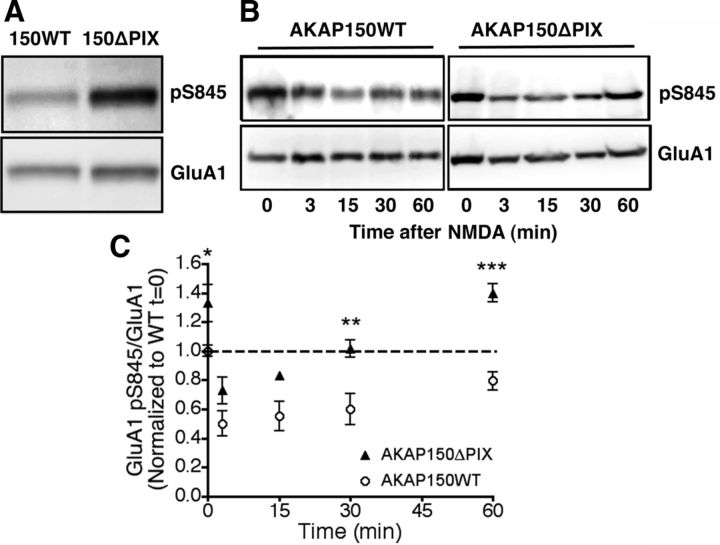
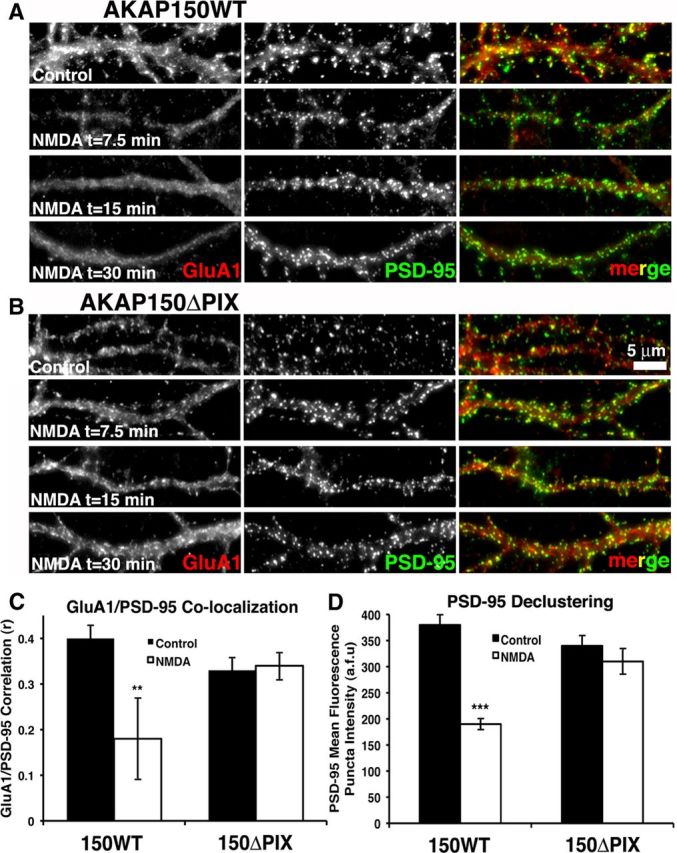
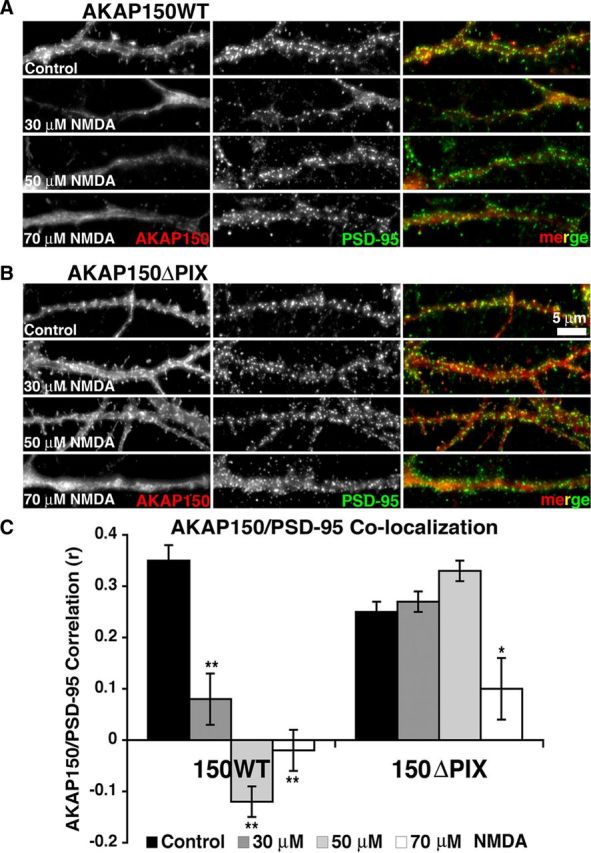
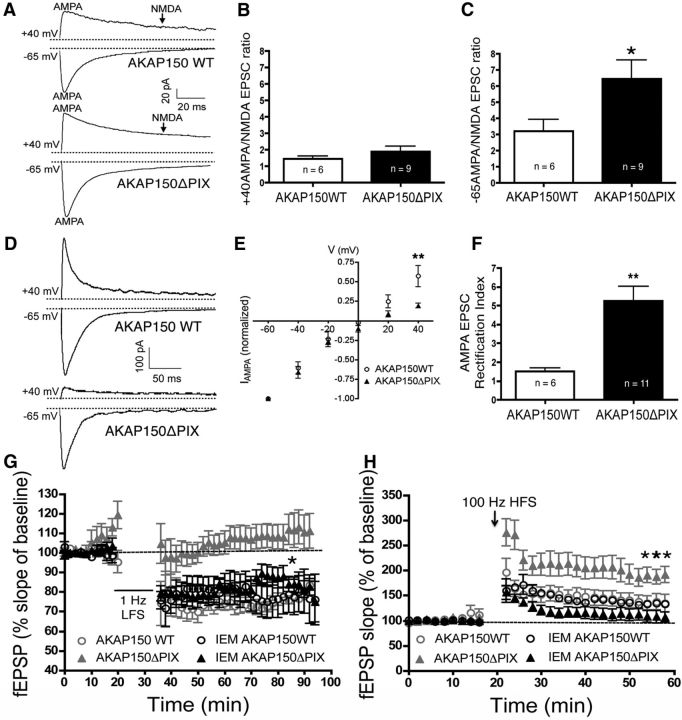
AMPA receptors (AMPARs) are tetrameric ion channels assembled from GluA1-GluA4 subunits that mediate the majority of fast excitatory synaptic transmission in the brain. In the hippocampus, most synaptic AMPARs are composed of GluA1/2 or GluA2/3 with the GluA2 subunit preventing Ca(2+) influx. However, a small number of Ca(2+)-permeable GluA1 homomeric receptors reside in extrasynaptic locations where they can be rapidly recruited to synapses during synaptic plasticity. Phosphorylation of GluA1 S845 by the cAMP-dependent protein kinase (PKA) primes extrasynaptic receptors for synaptic insertion in response to NMDA receptor Ca(2+) signaling during long-term potentiation (LTP), while phosphatases dephosphorylate S845 and remove synaptic and extrasynaptic GluA1 during long-term depression (LTD). PKA and the Ca(2+)-activated phosphatase calcineurin (CaN) are targeted to GluA1 through binding to A-kinase anchoring protein 150 (AKAP150) in a complex with PSD-95, but we do not understand how the opposing activities of these enzymes are balanced to control plasticity. Here, we generated AKAP150ΔPIX knock-in mice to selectively disrupt CaN anchoring in vivo. We found that AKAP150ΔPIX mice lack LTD but express enhanced LTP at CA1 synapses. Accordingly, basal GluA1 S845 phosphorylation is elevated in AKAP150ΔPIX hippocampus, and LTD-induced dephosphorylation and removal of GluA1, AKAP150, and PSD-95 from synapses are impaired. In addition, basal synaptic activity of GluA2-lacking AMPARs is increased in AKAP150ΔPIX mice and pharmacologic antagonism of these receptors restores normal LTD and inhibits the enhanced LTP. Thus, AKAP150-anchored CaN opposes PKA phosphorylation of GluA1 to restrict synaptic incorporation of Ca(2+)-permeable AMPARs both basally and during LTP and LTD.


Figures

Figure 1.
Figure 1.
Generation and characterization of CaN anchoring-deficient AKAP150ΔPIX knock-in mice. A, Schematics of the mouse akap5 gene encoding the WT AKAP150 allele, the akap5 targeting construct containing the ΔPIX mutation, and the targeted akap5 ΔPIX allele following homologous recombination. The single AKAP150 coding exon is shown as a thick black line, and the surrounding genomic sequence as a thin black line. The red rectangle indicates the 21 bp encoding the 7 aa of the ΔPIX deletion, the yellow rectangle indicates the in-frame insertion of a c-myc epitope tag at the C-terminal end of the AKAP150 coding sequence, and the green triangles indicate loxP sites that flank the neomycin resistance cassette in the 3′ flanking genomic DNA. B, PCR-based genotyping AKAP150WT and heterozygous and homozygous AKAP150ΔPIX littermate mice to detect the 21 bp ΔPIX deletion. C, Diagram of AKAP150 protein primary structure indicating removal of the PxIxIT-like 655-PIAIIIT-661 binding motif to selectively disrupt CaN-PP2B anchoring. D, Detection of AKAP150ΔPIX protein in whole-cell hippocampal extracts from homozygous mice by anti-myc and anti-AKAP150 immunoblotting (IB). E, The AKAP150ΔPIX mutation selectively eliminates anti-AKAP150 coimmunoprecipitation (IP) of CaNA subunits but not PKA-C or RII subunits. Input, Whole-cell hippocampal extract. F, Hippocampal subcellular fractions were prepared by differential centrifugation and immunoblotted to detect multiple components of the AKAP79/150 signaling as indicated. Quantification of relative densities (see Table 1) revealed that all proteins in the complex showed essentially normal expression levels and subcellular distributions except N-cad, which was decreased 45 ± 6% in the P2 fraction for ΔPIX compared with WT (p = 0.019).
Figure 2.
Figure 2.
AKAP150ΔPIX mice exhibit normal hippocampal anatomy and localization of AKAP150 and CaN in area CA1. A, Coronal sections from 300-μm-thick acute brain slices prepared from AKAP150WT and AKAP150ΔPIX mice stained with DAPI to visualize nuclei in the cell body layers of the hippocampal CA1 and dentate gyrus (DG) regions. B, Immunostaining of AKAP150 (green), the CaNB regulatory subunit (red), and nuclei (DAPI, blue) in the hippocampal CA1 region of acute brain slices. Colocalization of AKAP150 and CaNB appears yellow in the merge panels. C, D, Quantification of AKAP150 (C) and CaNB (D) localization in CA1 dendritic versus somatic/cell body areas from B calculated as dendrite/soma mean fluorescence intensity ratios. E, Relative colocalization of AKAP150 and CaNB in CA1 dendritic areas from B measured by a fluorescence intensity correlation coefficient (r). F, Representative images of Golgi stained dendrites in the CA1 region from WT and ΔPIX mice. Error bars indicate SEM.
Figure 3.
Figure 3.
AKAP150ΔPIX mice exhibit normal basal excitatory synaptic transmission in CA1 hippocampal pyramidal neurons. A, Representative fEPSP recordings at SC–CA1 synapses recorded in stratum radiatum of acute hippocampal slices prepared from 2- to 3-week-old AKAP150ΔPIX and WT mice. The fEPSP responses shown are from paired-pulse facilitation ratio (PPR) measurements in C using an interstimulus interval of 50 ms. B, Input–output curves of fEPSP slope (in millivolts/millisecond) plotted versus stimulus intensity (in volts) for CA1 synapses in AKAP150ΔPIX (filled triangles) and WT (open circles) mice. C, PPR measurements of percentage fEPSP2/fEPSP1 amplitude for recordings as in A for ΔPIX and WT mice across a range of different interstimulus intervals. D, Representative whole-cell mEPSC recordings from CA1 pyramidal neurons in acute slices from ΔPIX and WT mice. E–H, Cumulative distribution plots and inset bar graphs (means) of sEPSC amplitudes (in picoamperes) (E), sEPSC frequency (interevent interval, means in hertz) (F), mEPSC amplitudes (in picoamperes) (G), and mEPSC frequency (interevent interval, means in hertz) (H) for ΔPIX and WT mice. Error bars indicate SEM. *p < 0.05.
Figure 4.
Figure 4.
AKAP150ΔPIX mice exhibit normal basal inhibitory synaptic transmission in CA1 hippocampal pyramidal neurons. A, Representative whole-cell mIPSC recordings from CA1 pyramidal neurons in acute slices from AKAP150ΔPIX and WT mice. B–E, Cumulative distribution plots and inset bar graphs (means) for sIPSC amplitudes (in picoamperes) (B), sIPSC frequency (interevent interval, means in hertz) (C), mIPSC amplitudes (in picoamperes) (D), and mIPSC frequency (interevent interval, means in hertz) (E) for ΔPIX and WT mice. Error bars indicate SEM.
Figure 5.
Figure 5.
NMDAR-dependent LTD is impaired at CA1 synapses of AKAP150ΔPIX mice. A, One hertz LFS (900 pulses) LTD induction in the SC–CA1 pathway of acute hippocampal slice prepared from 2- to 3-week-old WT (open circles) but not AKAP150ΔPIX mice (filled triangles). fEPSP slope is plotted over time as percentage of the baseline before LFS. B, Representative fEPSP recordings from A for before and after LFS in WT and ΔPIX mice. C, One hertz PP-LFS (900 paired pulses, 50 ms interpulse interval) induction of LTD in WT but not ΔPIX mice. D, Ten hertz stimulation induction of a transient fEPSP slope depression in WT but not ΔPIX mice. Error bars indicate SEM. *p < 0.05, **p < 0.01.
Figure 6.
Figure 6.
NMDAR-dependent LTP is enhanced at CA1 synapses of AKAP150ΔPIX mice. A, Enhanced 1 × 100 Hz HFS (1 s) induction of LTP in the SC–CA1 pathway of acute hippocampal slices prepared from 2- to 3-week-old AKAP150ΔPIX mice (open circles) compared with WT mice (filled triangles). fEPSP slope is plotted over time as percentage of the baseline before HFS. B, Similar LTP induction with 50 Hz, 2 s stimulation in WT and ΔPIX mice. C, D, LTP (induced 30 min earlier by 1 × 100 Hz HFS) is only partially depotentiated by 1 Hz LFS in ΔPIX compared with WT mice (C), but a similar relative percentage depotentiation is observed (D). Error bars indicate SEM. *p < 0.05.
Figure 7.
Figure 7.
Basal phosphorylation of GluA1 S845 is increased and dephosphorylation following NMDA-cLTD treatment is impaired in AKAP150ΔPIX mice. A, Immunoblots of phospho(p)-S845 and total GluA1 levels in whole-cell extracts of hippocampal tissue from WT and AKAP150ΔPIX mice. B, Immunoblots of pS845 and total GluA1 levels in whole-cell extracts of hippocampal slices from WT and AKAP150ΔPIX mice before (t = 0 min) and at the indicated times after NMDA-cLTD (20 μm, 3 min) treatment. C, Quantification of immunoblots as in B for pS845/GluA1 dephosphorylation over time (normalized to WT t = 0 min) after NMDA-cLTD in WT and ΔPIX hippocampal slices. Error bars indicate SEM. *p < 0.05, **p < 0.01, ***p < 0.001.
Figure 8.
Figure 8.
GluA1 and PSD-95 are not removed from synapses following NMDA-cLTD in hippocampal neurons cultured from AKAP150ΔPIX mice. A, B, Immunostaining of GluA1 (red) and PSD-95 (green) in dendrites of hippocampal neurons cultured from AKAP150 WT (A) and AKAP150ΔPIX (B) mice under control conditions or at the indicated times after NMDA-cLTD treatment (50 μm NMDA, 5 min). Colocalization of GluA1 and PSD-95 puncta appears yellow in the merge panels. C, Quantification of a fluorescence intensity correlation coefficient (r) to measure dendritic colocalization of GluA1 and PSD-95 from A and B for control conditions and t = 30 min after NMDA in WT and AKAP150ΔPIX neurons. D, Quantification of the mean fluorescence intensity of PSD-95 dendritic puncta from A and B for control conditions and t = 30 min after NMDA in WT and ΔPIX neurons. Error bars indicate SEM. **p < 0.01, ***p < 0.001.
Figure 9.
Figure 9.
Removal of AKAP150 from synapses following NMDA-cLTD is impaired in hippocampal neurons cultured from AKAP150ΔPIX mice. A, B, Immunostaining of AKAP150 (red) and PSD-95 (green) in dendrites of hippocampal neurons cultured from WT (A) and AKAP150ΔPIX (B) mice under control conditions or 30 min after cLTD treatment (5 min) with the indicated doses of NMDA. Colocalization of AKAP150 and PSD-95 puncta appears yellow in the merge panels. C, Quantification of a fluorescence intensity correlation coefficient (r) to measure dendritic colocalization of AKAP150 and PSD-95 from A and B for control conditions and 30 min after treatment with the indicated doses of NMDA in WT and AKAP150ΔPIX neurons. Error bars indicate SEM. *p < 0.05, **p < 0.01.
Figure 10.
Figure 10.
AKAP150ΔPIX mice exhibit increased synaptic activity of GluA2-lacking Ca2+-permeable AMPA receptors that inhibit LTD and enhance LTP expression at CA1 synapses. A, Representative evoked SC–CA1 eEPSC recordings of fast-inward AMPAR current at −65 mV holding potential and fast-outward AMPAR plus slow-outward NMDAR current (arrows) at +40 mV holding potential from CA1 pyramidal neurons in acute hippocampal slices from ΔPIX and WT mice. B, Mean +40 mV AMPA/NMDA eEPSC ratios for ΔPIX and WT mice. C, Mean −65 mV AMPA/NMDA eEPSC ratios for ΔPIX and WT mice. D, Representative pharmacologically isolated AMPAR eEPSC recordings from ΔPIX and WT CA1 neurons with inclusion of spermine in the recording electrode for −65 and +40 mV holding potentials. E, Normalized I--V curve of pharmacologically isolated AMPAR eEPSCs in ΔPIX and WT CA1 neurons. F, Mean AMPAR eEPSC −65/+40 mV rectification indices for ΔPIX and WT neurons. G, Application of IEM1460 (70 μm) after 1 Hz LFS LTD induction in the SC–CA1 pathway of acute hippocampal slice prepared from 2- to 3-week-old WT (black, open circles) and ΔPIX mice (black, filled triangles). fEPSP slope is plotted over time as percentage of the baseline before LFS. Traces for untreated (control) WT (gray, open circles) and ΔPIX (gray, filled triangles) slices are reproduced from Figure 5A. H, Application of IEM1460 after 1 × 100 Hz HFS LTP induction in the SC–CA1 pathway of acute hippocampal slice prepared from 2- to 3-week-old WT (black, open circles) and ΔPIX mice (black, filled triangles). fEPSP slope is plotted over time as percentage of the baseline before HFS. Traces for WT (gray, open circles) and ΔPIX (gray, filled triangles) slices are reproduced from Figure 6A. Error bars indicate SEM. *p < 0.05, **p < 0.01, ***p < 0.001.

Similar articles

Cited by

References

    1. Adesnik H, Nicoll RA. Conservation of glutamate receptor 2-containing AMPA receptors during long-term potentiation. J Neurosci. 2007;27:4598–4602. - PMC - PubMed
    1. Ashby MC, De La Rue SA, Ralph GS, Uney J, Collingridge GL, Henley JM. Removal of AMPA receptors (AMPARs) from synapses is preceded by transient endocytosis of extrasynaptic AMPARs. J Neurosci. 2004;24:5172–5176. - PMC - PubMed
    1. Banke TG, Bowie D, Lee H, Huganir RL, Schousboe A, Traynelis SF. Control of GluR1 AMPA receptor function by cAMP-dependent protein kinase. J Neurosci. 2000;20:89–102. - PMC - PubMed
    1. Beattie EC, Carroll RC, Yu X, Morishita W, Yasuda H, von Zastrow M, Malenka RC. Regulation of AMPA receptor endocytosis by a signaling mechanism shared with LTD. Nat Neurosci. 2000;3:1291–1300. - PubMed
    1. Bhattacharyya S, Biou V, Xu W, Schlüter O, Malenka RC. A critical role for PSD-95/AKAP interactions in endocytosis of synaptic AMPA receptors. Nat Neurosci. 2009;12:172–181. - PMC - PubMed

Publication types

MeSH terms

LinkOut - more resources