. 2012 Oct 24;32(43):15158-68.
doi: 10.1523/JNEUROSCI.0845-12.2012.

Emergence of selectivity and tolerance in the avian auditory cortex

Affiliations

Emergence of selectivity and tolerance in the avian auditory cortex

C Daniel Meliza et al. J Neurosci. .

Abstract

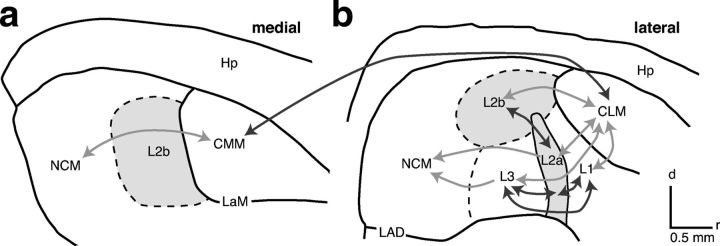
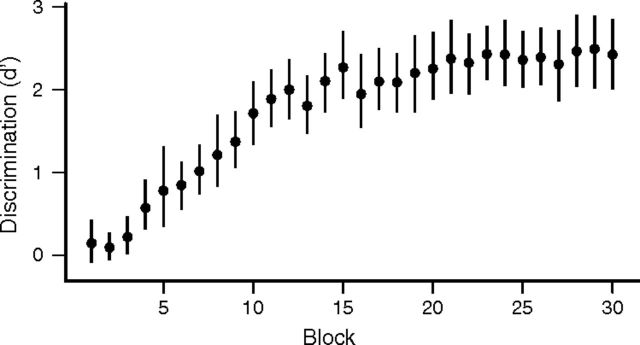
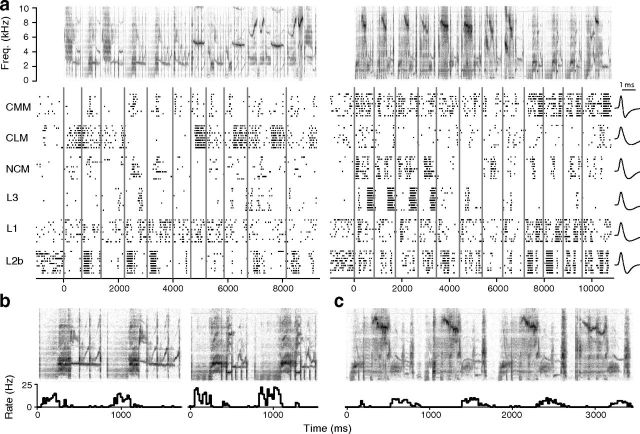
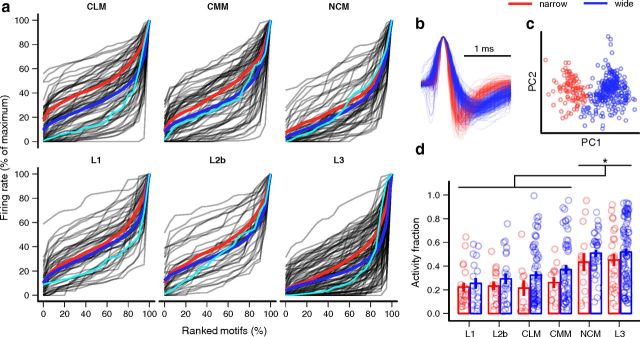
The ability to recognize auditory objects like words and bird songs is thought to depend on neural responses that are selective between categories of the objects and tolerant of variation within those categories. To determine whether a hierarchy of increasing selectivity and tolerance exists in the avian auditory system, we trained European starlings (Sturnus vulgaris) to differentially recognize sets of songs, then measured extracellular single unit responses under urethane anesthesia in six areas of the auditory cortex. Responses were analyzed with a novel, generalized linear mixed model that provides robust estimates of the variance in responses to different stimuli. There were significant differences between areas in selectivity, tolerance, and the effects of training. The L2b and L1 subdivisions of field L had the least selectivity and tolerance. The caudal nidopallium (NCM) and subdivision L3 of field L were more selective than other areas, whereas the medial and lateral caudal mesopallium were more tolerant than NCM or L2b. L3 had a multimodal distribution of tolerance. Sensitivity to songs that were familiar and those that were not also distinguished the responses of caudomedial mesopallium and NCM. There were significant differences across areas between neurons with wide and narrow spikes. Collectively these results do not fit the traditional hierarchical view of the avian auditory forebrain, but are consistent with emerging concepts homologizing avian cortical and neocortical circuitry. The results suggest a functional divergence within the cortex into processing streams that respond to complementary aspects of the variability in communicative sounds.


Figures

Figure 1.
Figure 1.
Auditory areas of the avian cortex. Outlines are traced from two parasagittal sections from a European starling at 0.6 mm (a) and 1.8 mm (b) from the midline. Dashed lines indicate boundaries that are defined by gradual transitions between cytoarchitectures. L2a and L2b (light gray) are the primary thalamorecipient areas. Arrows represent connections between areas as described in zebra finches (Vates et al., 1996) and pigeons (Wild et al., 1993); darker arrows indicate connections within larger subdivisions. Hp, hippocampus; LaM, lamina mesopallialis; LAD, lamina arcopallialis dorsalis; all other areas are subdivisions of field L.
Figure 2.
Figure 2.
Behavioral performance of starlings during operant discrimination training. Symbols show mean d′ with 95% confidence intervals across birds (n = 14), estimated by bootstrapping. Blocks are 100 trials each.
Figure 3.
Figure 3.
Responses of exemplar neurons. a, Spectrograms (top) show two of the song stimuli presented to the six neurons below, each a representative from one of the six auditory areas. Responses are shown as raster plots, with vertical ticks indicating the spike times and each row corresponding to the response on a different trial. Vertical gray lines mark the onsets of the component motifs. Traces on the far right show the average shape of each neuron's spikes. The CMM and L2b spikes were classified as narrow; the others were wide (see Materials and Methods). b, Detail of motifs 4–5 and 9–10 in the first and second songs, respectively, with histogram of the L2b neuron's response below (bin size = 20 ms). c, Detail of motifs 1–4 in the second song, with histogram of the L3 neuron's response. Detail spectrograms have same frequency scale as in a.
Figure 4.
Figure 4.
Motif selectivity of wide- and narrow-spike neurons in cortical auditory areas. a, Cumulative distributions of average firing rate evoked by the motifs presented to each neuron (gray lines). Distributions are normalized by the maximum response. Cyan lines correspond to exemplar neurons from Figure 3, and the thick red and blue lines are the average of the distributions for the narrow- and wide-spike neurons in each area. b, Average spike shapes for narrow-spike (red traces) and wide-spike neurons (blue traces). c, Projections of spike waveforms for each neuron onto the first two principal components of the spike shape. d, AF (selectivity) by area and spike type. Areas have been ordered to emphasize increasing selectivity. Circles represent individual neurons, which have been horizontally jittered for clarity. Error bars indicate mean ± SE. NCM and L3 have higher selectivity than the other areas (*p < 0.05), and selectivity is higher for wide-spike neurons (p = 0.01).
Figure 5.
Figure 5.
Variability within motif types and neuronal tolerance. a, Spectrogram of a song segment comprising two distinct motif types (A, B) repeated with variations in acoustic structure. Below are rasters of responses from a CMM and an NCM neuron demonstrating tolerance (CMM) and sensitivity (NCM) to motif variability. b, Mean response of the CMM neuron to each of the presented motif variants (gray circles), grouped by type. Hollow squares indicate the average for each type, and the x-axis is in ascending order of these averages. A and B labels correspond to the motif types shown in a. Horizontal gray line indicates spontaneous firing rate. c, The motif type and variant distribution for the exemplar NCM neuron, illustrating the greater variance in its responses to motif variants. Both neurons were presented with the same set of motifs.
Figure 6.
Figure 6.
Selectivity and stimulus-independent variance of neural responses in different regions of the auditory cortex. a, Overall selectivity (S′; see Materials and Methods) of neurons by area and spike type (red symbols, narrow spikes; blue symbols, wide spikes). There are significant differences among areas (two-way log-transformed ANOVA: F(5,361) = 12.27, p = 10−10), but not between spike types (F(1,361) = 0.50, p = 0.48) or for their interaction (F(5,361) = 1.61, p = 0.16). b, Stimulus-independent variability. Differences among areas and between spike types are significant (two-way rank-transformed ANOVA: F(5,361) = 9.26, p = 10−7; F(1,361) = 27.40, p = 10−6), but the interaction is not (F(5,361) = 1.89, p = 0.10). In a and b, circles are individual neurons (horizontally jittered for clarity). Error bars indicate mean ± SE. Areas are ordered as in Figure 4d. *, Significant post hoc differences between areas, with p < 0.05.
Figure 7.
Figure 7.
Tolerance for within-type variability differs among areas. a, Selectivity between motif types by area and spike type (red symbols, narrow spikes; blue symbols, wide spikes). Differences among areas are significant (two-way rank-transformed ANOVA: F(5,361) = 8.24, p = 10−6), but not between spike types (F(1,361) = 1.56, p = 0.21) or for the interaction (F(5,361) = 0.78, p = 0.57). b, Selectivity between variants of the same motif type. Differences among areas are significant (two-way rank-transformed ANOVA: F(5,361) = 11.64, p = 10−9; Tukey's tests: p ≤ 0.04), but not the effect of spike type (F(1,361) = 0.15, p = 0.70) or the interaction (F(1,361) = 1.31, p = 0.26). c, Tolerance, defined as the ratio of between-type variance to the total stimulus-dependent variance. Differences among areas and between spike types are significant (two-way rank-transformed ANOVA: F(5,361) = 5.98, p = 0.0003; F(1,361) = 3.89, p = 0.049), but the interaction is not (F(5,361) = 0.91, p = 0.48). In a–c, circles are individual neurons (horizontally jittered for clarity). Error bars indicate mean ± SE. Areas are ordered as in Figure 4d. *, Significant post hoc differences between areas, with p < 0.05.
Figure 8.
Figure 8.
Effects of training on response distributions. a, Response strength distribution of exemplar CMM neuron (from Fig. 3) with motifs coded for familiarity (open circles) and unfamiliarity (filled squares). Larger symbols indicate mean ± SD for each category. Horizontal gray line, average spontaneous rate. b, The same plot for the exemplar NCM neuron. c, Bias, the difference in mean response to familiar and unfamiliar motifs, by area. Circles represent individual neurons. Horizontal bars, mean for each area with 95% confidence intervals. *p < 0.05. d, SD between familiar motifs is plotted against SD between unfamiliar motifs for each area. The diagonal line indicates equality. Circles are individual neurons; squares indicate the mean difference with 95% confidence intervals. **p < 0.01. Both axes are on a log scale for visual clarity. No significant effect of spike type was observed on bias or the difference in selectivity, so the two classes of neurons are pooled in this figure.
Figure 9.
Figure 9.
Cortical model of avian auditory processing. Canonical interlaminar connectivity of primary mammalian auditory cortex. Connectivity among subdivisions of field L, CM, and NCM. The primary (lateral) areas show a similar pattern of connectivity from thalamorecipient to superficial to deep layers. There are separate connections from superficial and deep areas of the field L/CLM complex to the putative secondary areas CMM and NCM. Adapted from Wang et al. (2010) with addition of L2b, CMM, and NCM. The blue line represents thalamic input, the red circles and arrows indicate intrinsic connections, and the cyan arrow indicates descending projections. For clarity, the projection from L2b to NCM has been omitted, as well as connections from the shell of ovoidalis to L1, L3, and NCM, which are more diffuse and not tonotopic.

References

    1. Adret-Hausberger M, Jenkins P. Complex organization of the warbling song in starlings. Behaviour. 1988;107:138–156.
    1. Atencio CA, Schreiner CE. Spectrotemporal processing differences between auditory cortical fast-spiking and regular-spiking neurons. J Neurosci. 2008;28:3897–3910. - PMC - PubMed
    1. Atencio CA, Sharpee TO, Schreiner CE. Hierarchical computation in the canonical auditory cortical circuit. Proc Natl Acad Sci U S A. 2009;106:21894–21899. - PMC - PubMed
    1. Bonke D, Scheich H, Langner G. Responsiveness of units in the auditory neostriatum of the guinea fowl (Numida meleagris) to species-specific calls and synthetic stimuli. I. Tonotopy and functional zones. J Comp Physiol. 1979;132:243–255.
    1. Brooks SP, Gelman A. General methods for monitoring convergence of iterative simulations. J Comput Graph Stat. 1998;7:434–455.

Publication types

MeSH terms

LinkOut - more resources