. 2012 Oct 24;32(43):15181-92.
doi: 10.1523/JNEUROSCI.1542-12.2012.

Apolipoprotein E, especially apolipoprotein E4, increases the oligomerization of amyloid β peptide

Affiliations

Apolipoprotein E, especially apolipoprotein E4, increases the oligomerization of amyloid β peptide

Tadafumi Hashimoto et al. J Neurosci. .

Abstract

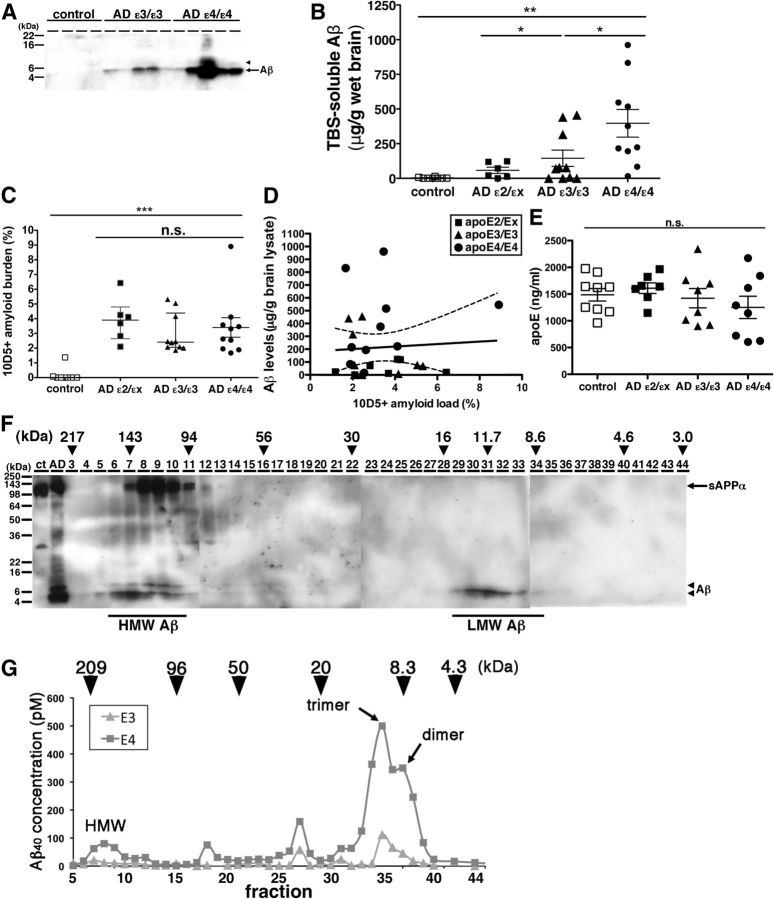
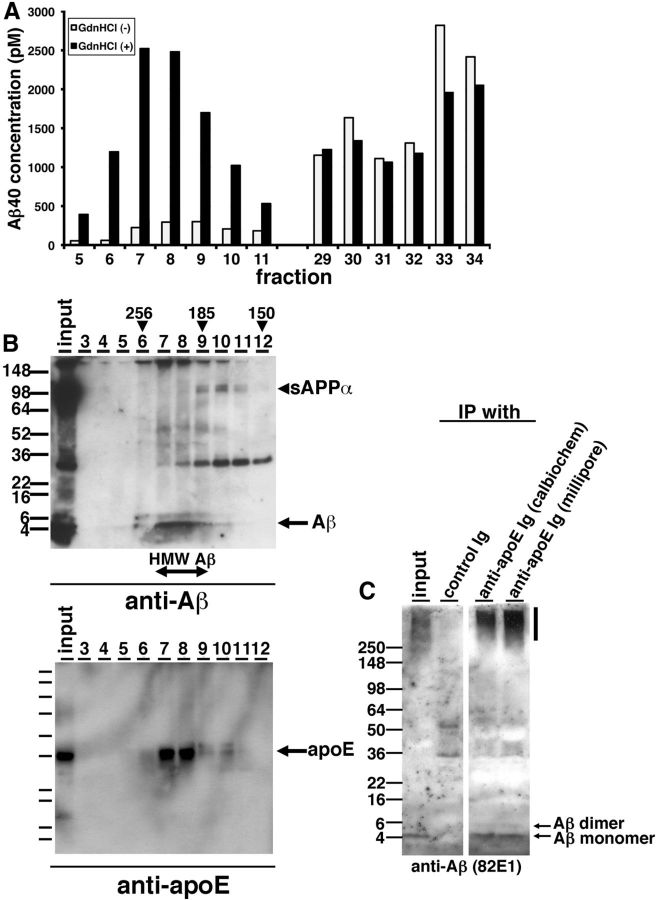
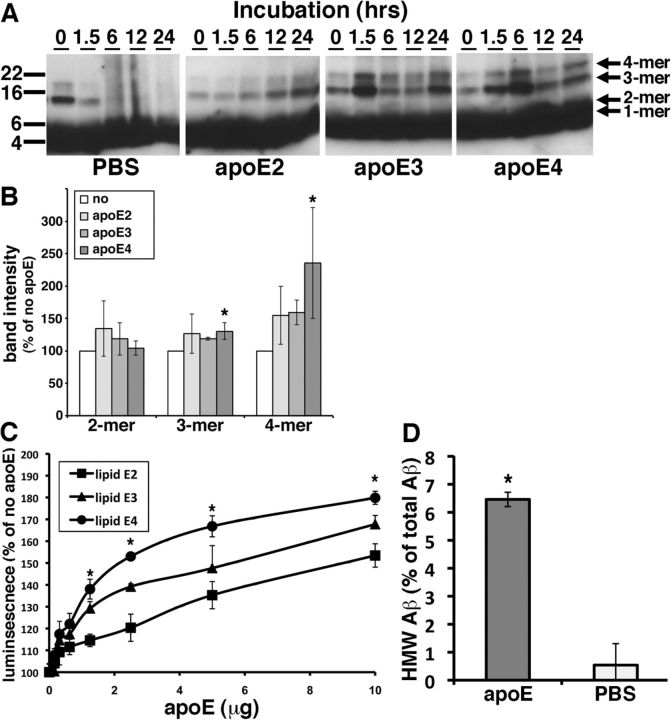
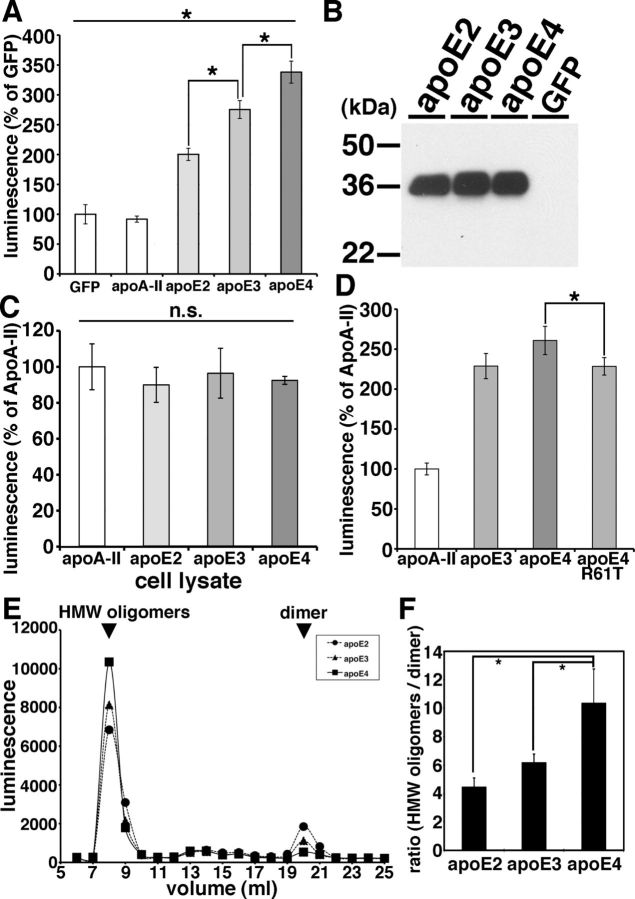
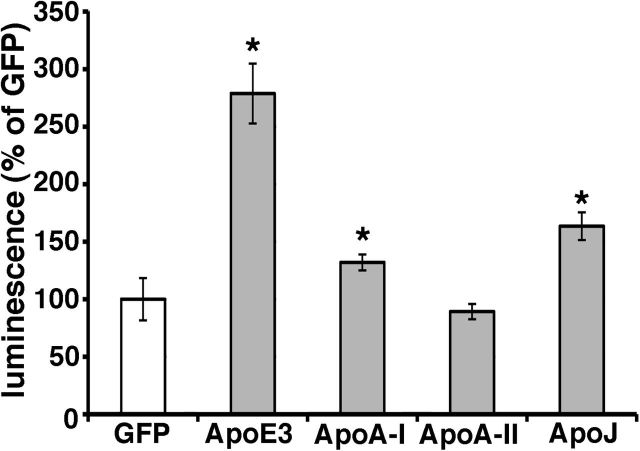
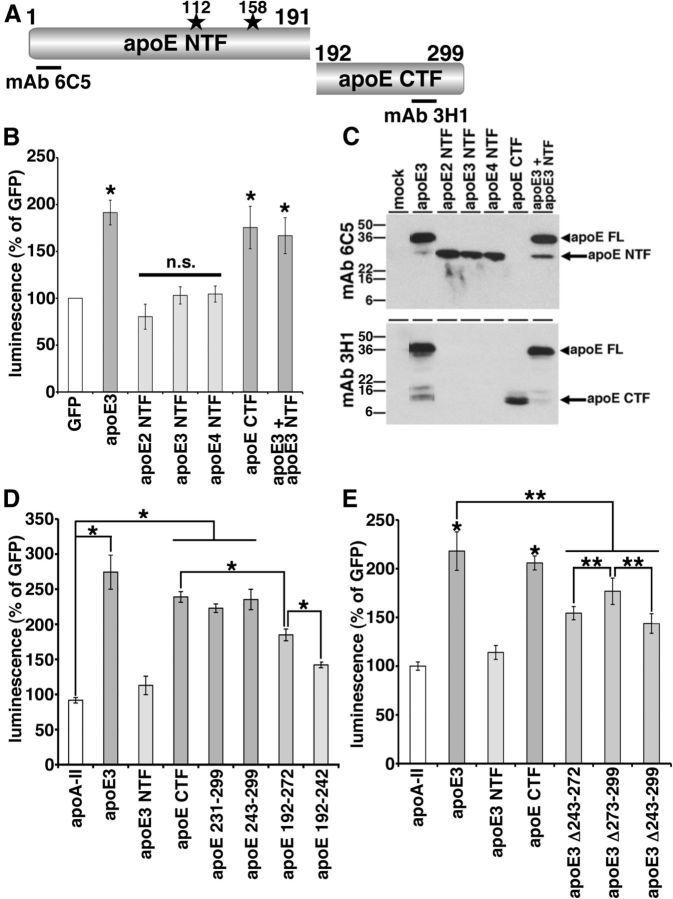
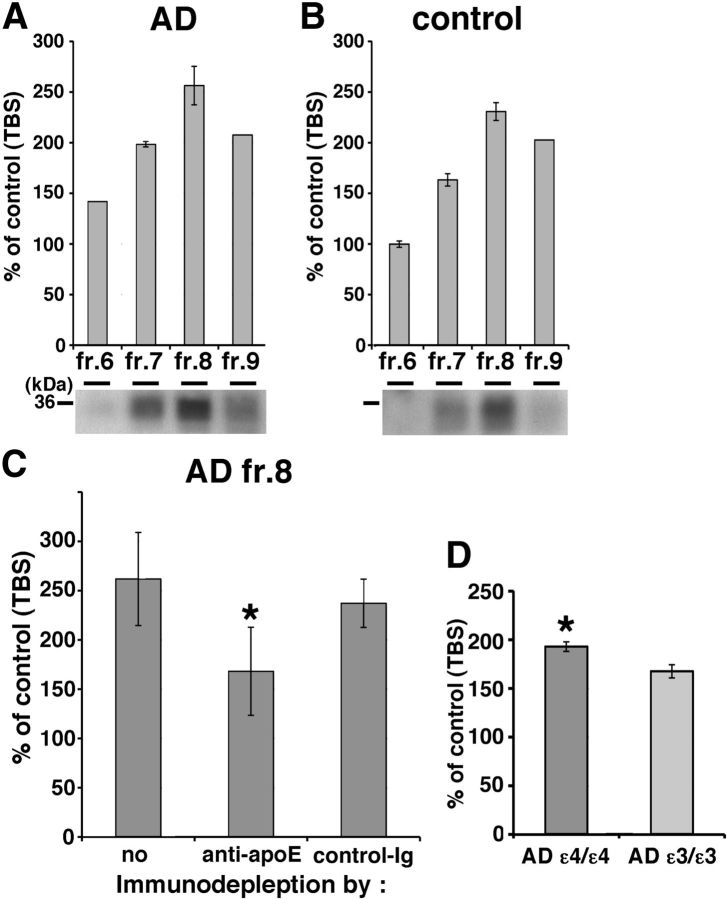
Alzheimer's disease (AD) is the most common progressive neurodegenerative disorder causing dementia. Massive deposition of amyloid β peptide (Aβ) as senile plaques in the brain is the pathological hallmark of AD, but oligomeric, soluble forms of Aβ have been implicated as the synaptotoxic component. The apolipoprotein E ε 4 (apoE ε4) allele is known to be a genetic risk factor for developing AD. However, it is still unknown how apoE impacts the process of Aβ oligomerization. Here, we found that the level of Aβ oligomers in APOE ε4/ε4 AD patient brains is 2.7 times higher than those in APOE ε3/ε3 AD patient brains, matched for total plaque burden, suggesting that apoE4 impacts the metabolism of Aβ oligomers. To test this hypothesis, we examined the effect of apoE on Aβ oligomer formation. Using both synthetic Aβ and a split-luciferase method for monitoring Aβ oligomers, we observed that apoE increased the level of Aβ oligomers in an isoform-dependent manner (E2 < E3 < E4). This effect appears to be dependent on the ApoE C-terminal domain. Moreover, these results were confirmed using endogenous apoE isolated from the TBS-soluble fraction of human brain, which increased the formation of Aβ oligomers. Together, these data show that lipidated apoE, especially apoE4, increases Aβ oligomers in the brain. Higher levels of Aβ oligomers in the brains of APOE ε4/ε4 carriers compared with APOE ε3/ε3 carriers may increase the loss of dendritic spines and accelerate memory impairments, leading to earlier cognitive decline in AD.


Figures

Figure 1.
Figure 1.
The level of Aβ oligomers in the brain of APOE ε4/ε4 AD patients was significantly higher compared with APOE ε3/ε3 AD patients. A, Immunoblotting of 50 μg of TBS-soluble fractions from 4 control, 5 APOE ε3/ε3 AD, and 5 APOE ε4/ε4 AD prefrontal brains. An anti-Aβ mAb 82E1 revealed Aβ monomers (arrow) and dimers (arrowhead). B, Quantification of TBS-soluble Aβ from 8 control (white squares), 6 APOE ε2/εx AD (dark squares), 10 APOE ε3/ε3 AD (dark triangles), and 10 APOE ε4/ε4 AD brains (black circles). The level of Aβ in APOE ε4/ε4 AD brains was significantly higher compared with control brains, APOE ε2/εx AD brains, and APOE ε3/ε3 AD brains. *p < 0.05, **p < 0.01, one-way ANOVA test (Tukey's post hoc test). C, Amyloid burden (%) in the prefrontal cortex of 8 control (white squares), 6 APOE ε2/εx AD (dark squares), 10 APOE ε3/ε3 AD (dark triangles), and 10 APOE ε4/ε4 AD brains (black circles) analyzed in this study. There is no significant difference among APOE ε2/εx AD, between APOE ε3/ε3 AD and APOE ε4/ε4 AD brains, one-way ANOVA test (Kruskal–Wallis test). D, Correlation analysis between the level TBS-soluble Aβ and the level of Aβ amyloid burden in 6 APOE ε2/εx AD (dark squares), 10 APOE ε3/ε3 AD (dark triangles), and 10 APOE ε4/ε4 AD brains (black circles). There is no significant difference. E, Quantification of apoE concentration in the TBS-soluble fraction of 8 control (white squares), 6 APOE ε2/εx AD (dark squares), 10 APOE ε3/ε3 AD (dark triangles), and 10 APOE ε4/ε4 AD brains (black circles). F, Immunoblotting of SEC-separated fractions from APOE ε4/ε4 AD brain. Anti-Aβ mAb 82E1 and 6E10 revealed Aβ (arrow) and sAPPα (arrowhead). Aβ eluted from 94 kDa to 217 kDa as HMW Aβ and eluted from 8.6 to 16 kDa as LMW Aβ. Estimated molecular weight (kDa) was indicated above (arrowheads). G, Representative data of the separation of 200 mg of TBS-soluble fractions of APOE ε3/ε3 AD (triangles) and APOE ε4/ε4 AD (squares) brains by double Superdex 75 SEC columns. The concentration of Aβ40 is measured by Aβ specific ELISA (BNT77-BA27) (Wako). Estimated molecular weight (kDa) was indicated above (arrowheads). Aβ in TBS-soluble fraction formed dimer, trimer and HMW oligomers.
Figure 2.
Figure 2.
apoE forms HMW complex with Aβ oligomers in the brains of AD patients. A, Representative data from guanidine-HCl treatment for SEC-separated fractions. SEC-separated fractions from 5 to 11, from 29 to 34 were incubated with (black) or without (white) 8 m guanidine HCl and quantified the Aβ concentration by specific ELISA (BNT77-BA27). B, Immunoblotting of SEC-separated fractions (fraction 3–12) from an APOE ε4/ε4 AD brain. Top, Anti-mAbs 82E1 and 6E10 revealed Aβ monomers (arrow), dimers, and sAPPα (arrowhead). Bottom, Anti-mAb 3H1 revealed apoE (arrow). Estimated molecular weight (kDa) is indicated above (arrowheads). C, Immunoprecipitation using anti-apoE antibodies and control antibody from SEC-separated fraction 8 and immunoblotted by an anti-Aβ mAb 82E1. Aβ monomers and dimmers were detected (arrows).
Figure 3.
Figure 3.
Purified apoE-containing HDL particles enhanced oligomer formation of synthetic Aβ1–42 in vitro. A, Immunoblotting for Aβ after incubation of 0.1 mg/ml synthetic Aβ1–42 with PBS, 10 μg of purified apoE2, 10 μg of apoE3, or 10 μg of apoE4 for the indicated times (hours). Anti-Aβ mAb 6E10 revealed Aβ monomer, dimer, trimer, and tetramer (arrows). B, Band intensity of remaining Aβ in SDS-polyacrylamide gels after incubation of synthetic Aβ1–42 oligomers with PBS (no), 5 μg/ml purified lipidated apoE2, apoE3, or apoE4 for 12 h using an anti-Aβ mAb 6E10. Lipidated apoE4 significantly increased the level of Aβ trimer and tetramer compared with no lipidated apoE samples. N = 6, average ± SD, *p < 0.05, one-way ANOVA test (Bonferroni's test). C, Luminescence from conditioned media containing split-luciferase-tagged Aβ oligomers incubated with 0, 0.1, 0.3, 0.6, 1.25, 2.5, 5, or 10 μg of purified apoE2 (lipid apoE2, squares), purified apoE3 (lipid apoE3, triangles), or purified apoE4 (lipid apoE4, circles) for 24 h. N = 6, average ± SD, *p < 0.05, one-way ANOVA test (Bonferroni's test). D, Incubation of LMW Aβ isolated from TBS-soluble fractions of the AD brains with (apoE) or without (PBS) 5 μg of purified lipid apoE3 and separated the samples by double Superdex 75 SEC columns. The concentration of Aβ40 was measured by Aβ-specific ELISA (BNT77-BA27, WAKO Chemicals) and obtained the ratio of HMW Aβ measured (in fraction 7 and 8). N = 4, average ± SD, *p < 0.05, student' t test.
Figure 4.
Figure 4.
ApoE enhanced the level of Aβ oligomers in an isoform-dependent manner. A, Transient transfection of GFP (control), apoA-II, apoE2, apoE3, or apoE4 into double-expressing HEK293 cells. Luminescence of conditioned media was measured. apoE3 significantly increased the luminescence compared with apoE2 and apoE4 significantly increased the luminescence compared with apoE3. N = 6, average ± SD, *p < 0.05, one-way ANOVA test (Bonferroni's test). B, Immunoblotting of conditioned media from GFP (control), apoE2, apoE3, or apoE4 transiently transfected double-expressing HEK293 cells by an anti-apoE mAb 3H1. C, Transient transfection of apoA-II, apoE2, apoE3, or apoE4 into double-expressing HEK293 cells. Luminescence of cell lysates was measured. There is no significant difference of the luminescence among apoE2-, apoE3-, or apoE4-expressing cells. N = 6, average ± SD, one-way ANOVA test (Bonferroni's test). D, Transient transfection of apoA-II, apoE3, apoE4, or apoE4 R61T mutant into double-expressing HEK293 cells. Luminescence of conditioned media was measured. apoE4 significantly increased the luminescence compared with apoE4 R61T mutant. N = 6, average ± SD, *p < 0.05, one-way ANOVA test (Bonferroni's test). E, Transient transfection of apoE2, apoE3, or apoE4 into double-expressing HEK293 cells and separation of conditioned media by a SEC column Superdex 200. Representative data of the luminescence profile of the elutants from conditioned media of apoE2 (circles)-, apoE3 (triangles)-, or apoE4 (squares)-transfected cells. Two peaks, HMW oligomers and dimers (arrows) were observed. F, Average ratio between HMW oligomers and dimers. N = 3, average ± SD, *p < 0.01, one-way ANOVA test (Bonferroni's test).
Figure 5.
Figure 5.
ApoA-I and apoJ enhanced the level of Aβ oligomers. Transient transfection of GFP (control), apoA-I, apoA-II, apoJ/clusterin, or apoE3 into double-expressing HEK293 cells. Luminescence of conditioned media was measured. apoA-I, apoJ/clusterin, or apoE3 significantly increased the luminescence. N = 6, average ± SD, *p < 0.05, one-way ANOVA test (Bonferroni's test).
Figure 6.
Figure 6.
Lipid-binding domain of apoE was necessary for the enhancement of Aβ oligomers. A, Schematic structure of apoE and apoE fragments. The epitopes of mAb 6C5 and mAb 3H1 is illustrated. B, Transient transfection of GFP, apoE3, apoE2 NTF, apoE3 NTF, apoE4 NTF, apoE CTF, or both apoE3 and apoE3 NTF into double-expressing HEK293 cells. Luminescence of conditioned media was measured. apoE3 and apoE CTF significantly increased the luminescence, on the other hand, apoE2 NTF, apoE3 NTF, or apoE4 NTF did not increase the luminescence. N = 6, average ± SD, *p < 0.05, one-way ANOVA test (Bonferroni's test). C, Immunoblotting of conditioned media by the anti-apoE mAb 6C5 (top) and 3H1 (bottom panel). MAb 6C5 revealed 36 kDa band (full-length apoE, arrowhead) and 26 kDa band (apoE NTF, arrow). MAb 3H1 revealed also 36 kDa band (full-length apoE, arrowhead) and 10 kDa doublet band (apoE CTF, arrow). D, Transient transfection of GFP, apoA-II, apoE3, apoE3 NTF, apoE CTF, apoE 231–299, apoE 243–299, apoE 192–272, and apoE 192–242 into double-expressing HEK293 cells. Luminescence of conditioned media was measured. apoE3 significantly increased the luminescence compared with apoA-II, apoE CTF fragments. apoE CTF significantly increased the luminescence compared with apoE 192–272 and apoE 192–272 significantly increased the luminescence compared with apoE 192–242. N = 6, average ± SD, *p < 0.05, one-way ANOVA test (Bonferroni's test). E, Transient transfection of GFP, apoA-II, apoE3, apoE3 NTF, apoE CTF, apoE3 Δ243–272, apoE3 Δ273–299, and apoE3 Δ243–299 into double-expressing HEK293 cells. Luminescence of conditioned media was measured. apoE3 and apoE CTF significantly increased the luminescence compared with apoA-II. ApoE3 also significantly increased the luminescence compared with three apoE3 deletion mutants. ApoE3 Δ273–299 significantly increased the luminescence compared with apoE3 Δ243–272 or apoE3 Δ243–299. N = 6, average ± SD, *p < 0.01, **p < 0.05, one-way ANOVA test (Bonferroni's test).
Figure 7.
Figure 7.
Endogenous apoE in the brain increases the level of Aβ oligomers. A, B, Luminescence of SEC-separated fraction 6, 7, 8, or 9 from TBS-soluble fraction of AD (A) or control (B) brain incubated with split-luciferase-tagged Aβ oligomers for 24 h. An anti-apoE antibody revealed 36 kDa apoE protein (bottom). C, Immunodepletion of fraction 8 of AD brains using no antibody, anti-apoE mAb 3H1 or control Ig. Luminescence from immunodepleted fraction 8 of AD brains incubated with split-luciferase-tagged Aβ oligomers for 24 h. Anti-apoE mAb 3H1 significantly reduced the luminescence compared with control Ig. N = 4, average ± SD, *p < 0.05, one-way ANOVA test (Bonferroni's test). D, Luminescence of SEC-separated fraction 8 from TBS-soluble fraction of 4 APOE ε4/ε4 AD brains and 4 APOE ε3/ε3 AD brains incubated with split-luciferase-tagged Aβ oligomers for 24 h. Fraction 8 from APOE ε4/ε4 AD brains significantly increased the level of Aβ oligomers compared with that APOE ε3/ε3 AD brains. Average ± SD, *p < 0.05, one-way ANOVA test (Bonferroni's test).

References

    1. Bu G. Apolipoprotein E and its receptors in Alzheimer's disease: pathways, pathogenesis and therapy. Nat Rev Neurosci. 2009;10:333–344. - PMC - PubMed
    1. Castellano JM, Kim J, Stewart FR, Jiang H, DeMattos RB, Patterson BW, Fagan AM, Morris JC, Mawuenyega KG, Cruchaga C, Goate AM, Bales KR, Paul SM, Bateman RJ, Holtzman DM. Human apoE isoforms differentially regulate brain amyloid-β peptide clearance. Sci Transl Med. 2011;3:89ra57. - PMC - PubMed
    1. Chou CY, Lin YL, Huang LC, Sheu SY, Lin TH, Tsay HJ, Chang GG, Shiao MS. Structural variation in human apolipoprotein E3 and E4: secondary structure, tertiary structure and size distribution. Biophys J. 2005;88:455–466. - PMC - PubMed
    1. Corder EH, Saunders AM, Strittmatter WJ, Schmechel DE, Gaskell PC, Small GW, Roses AD, Haines JL, Pericak-Vance MA. Gene dose of apolipoprotein E type 4 allele and the risk of Alzheimer's disease in late onset families. Science. 1993;261:921–923. - PubMed
    1. DeMattos RB, O'dell MA, Parsadanian M, Taylor JW, Harmony JAK, Bales KR, Paul SM, Aronow BJ, Holtzman DM. Clusterin promotes amyloid plaque formation and critical for neuritic toxicity in a mouse model of Alzheimer's disease. Proc Natl Acad Sci U S A. 2002;99:10843–10848. - PMC - PubMed

Publication types

MeSH terms