. 2012 Oct;3(10):1220-35.
doi: 10.18632/oncotarget.714.

The mitochondrial citrate transporter, CIC, is essential for mitochondrial homeostasis

Affiliations

The mitochondrial citrate transporter, CIC, is essential for mitochondrial homeostasis

Olga Catalina-Rodriguez et al. Oncotarget. 2012 Oct.

Abstract

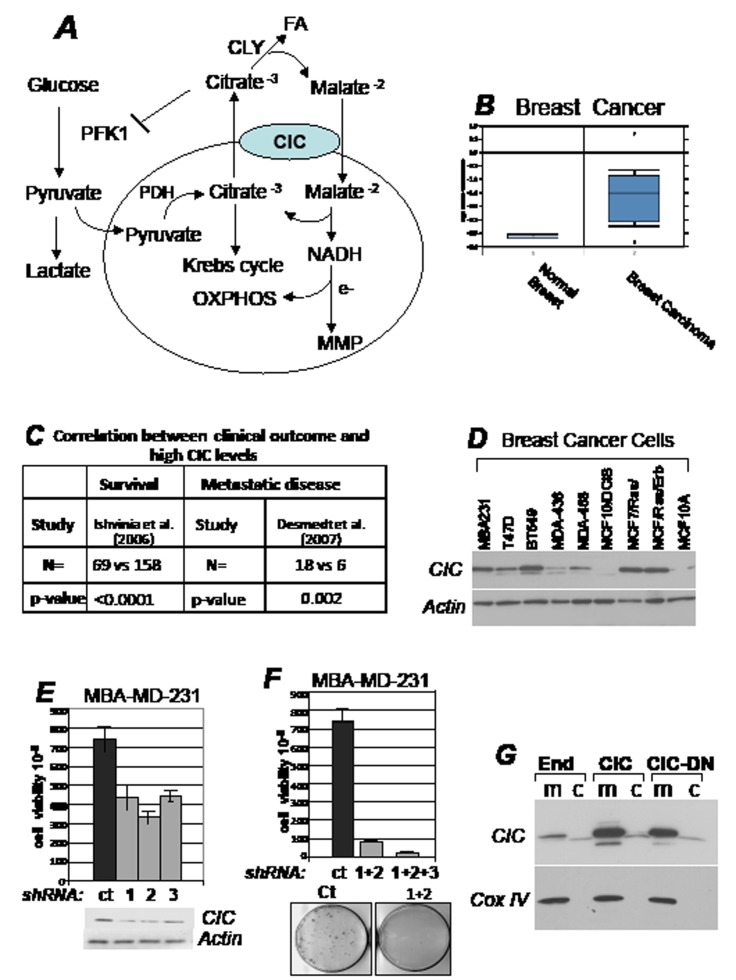
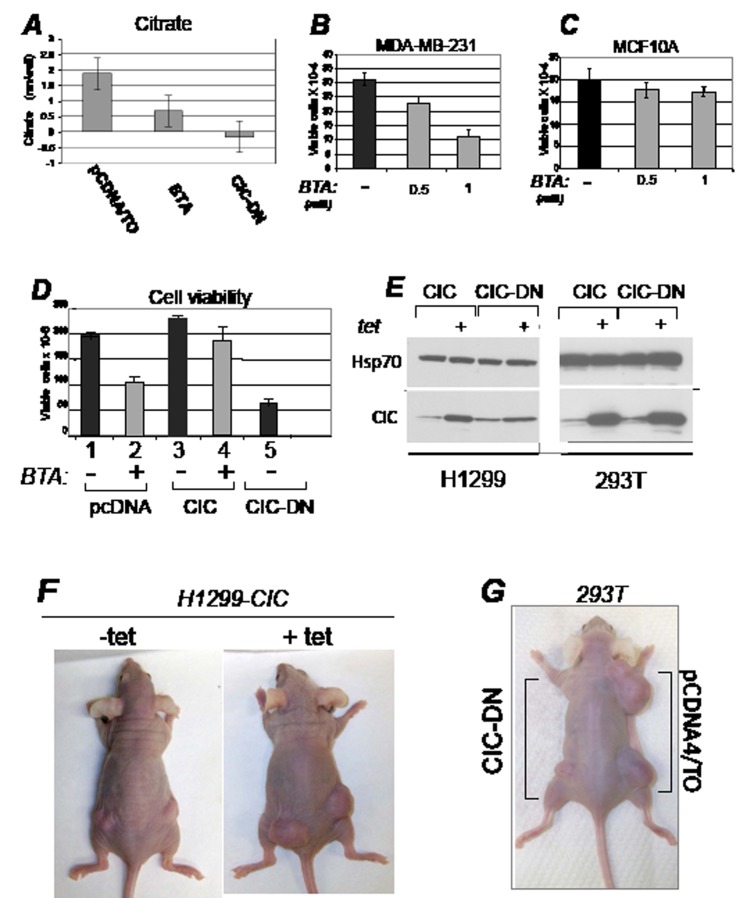
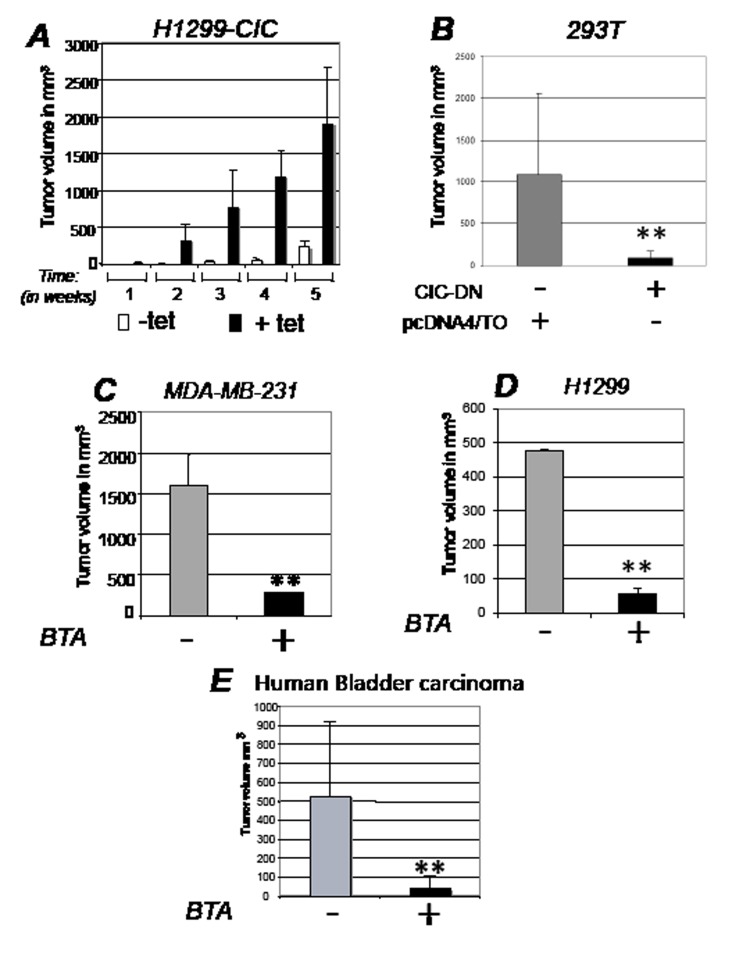
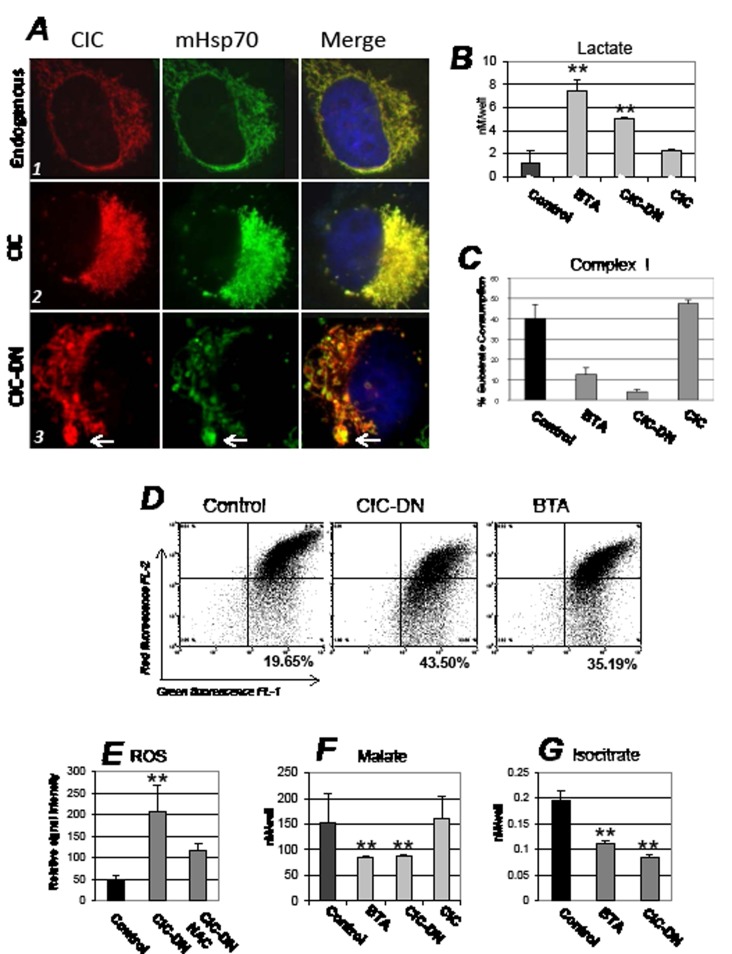
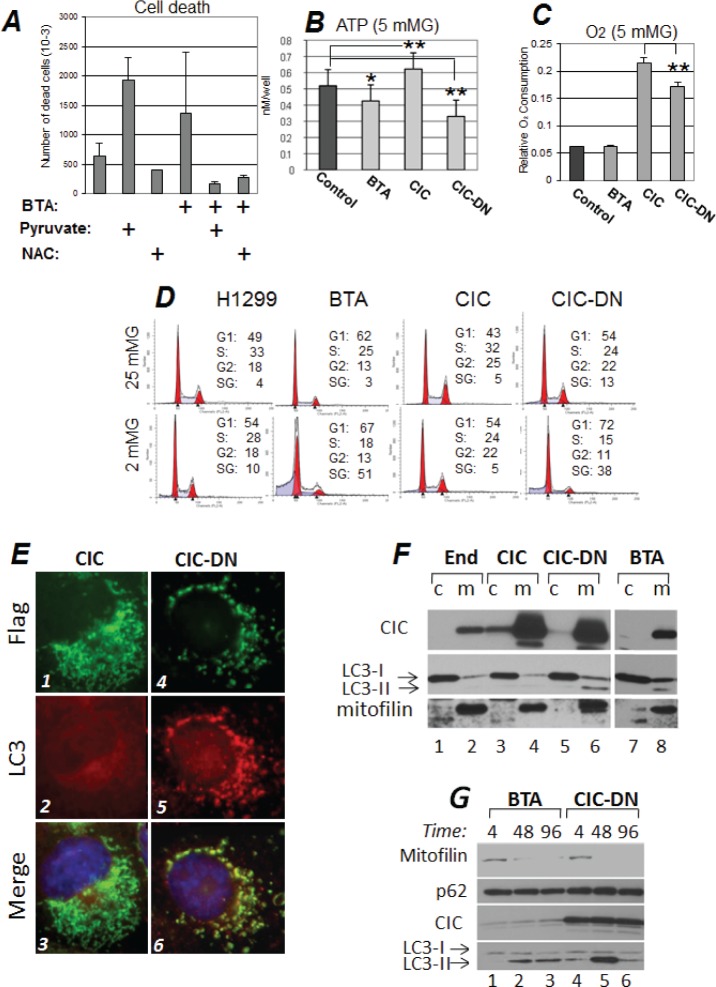
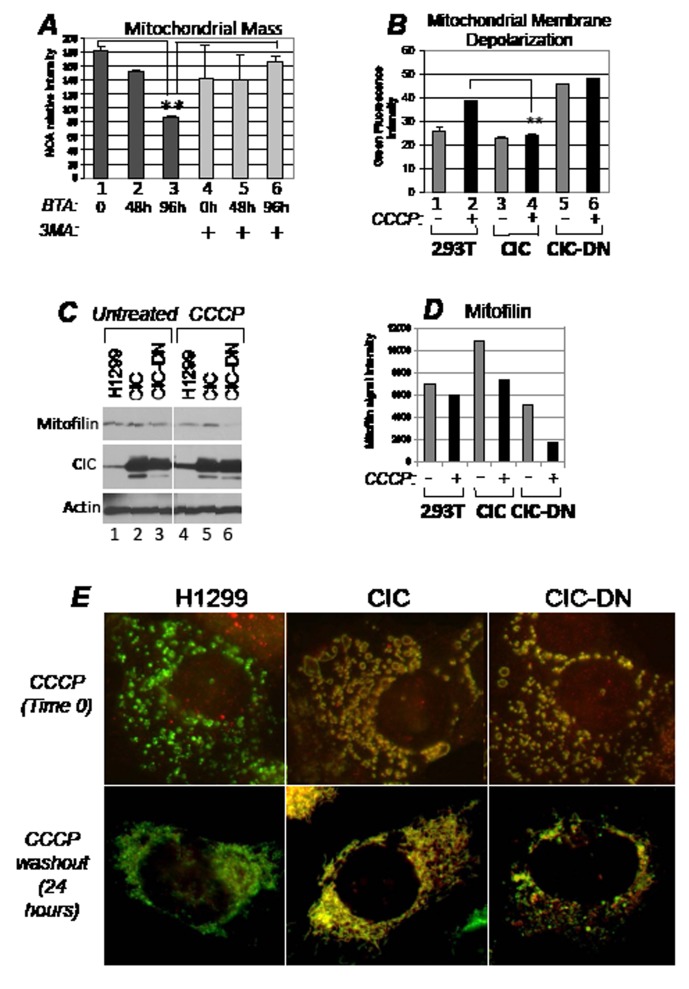
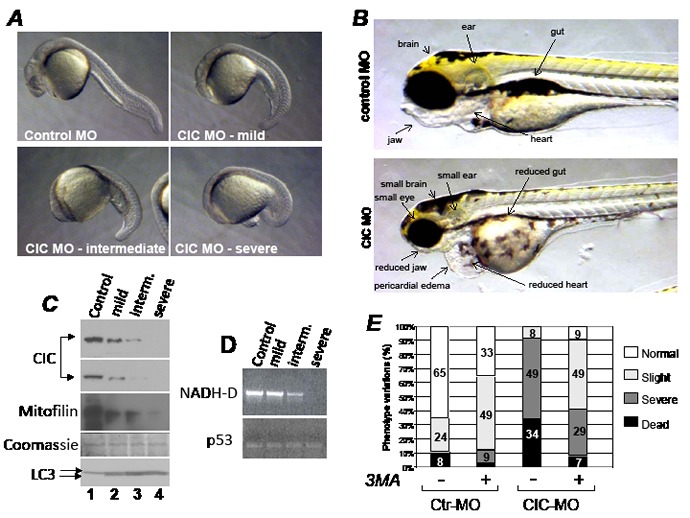
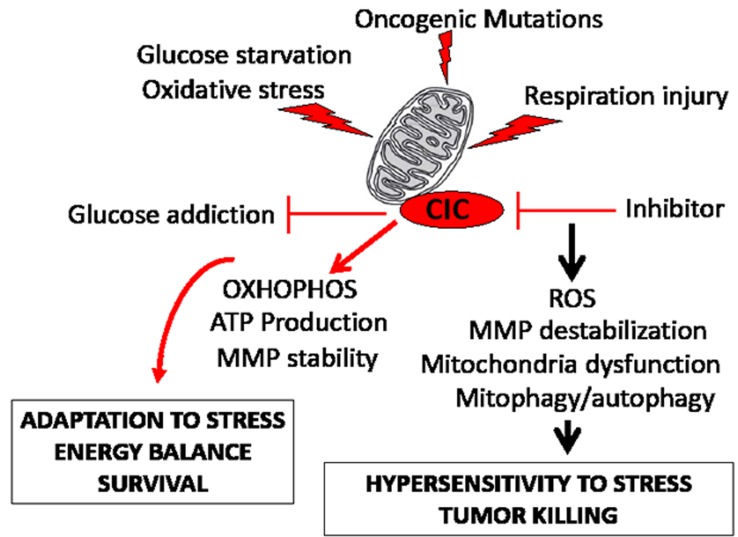
Dysregulation of the pathways that preserve mitochondrial integrity hallmarks many human diseases including diabetes, neurodegeration, aging and cancer. The mitochondrial citrate transporter gene, SLC25A1 or CIC, maps on chromosome 22q11.21, a region amplified in some tumors and deleted in developmental disorders known as velo-cardio-facial- and DiGeorge syndromes. We report here that in tumor cells CIC maintains mitochondrial integrity and bioenergetics, protects from mitochondrial damage and circumvents mitochondrial depletion via autophagy, hence promoting proliferation. CIC levels are increased in human cancers and its inhibition has anti-tumor activity, albeit with no toxicity on adult normal tissues. The knock-down of the CIC gene in zebrafish leads to mitochondria depletion and to proliferation defects that recapitulate features of human velo-cardio-facial syndrome, a phenotype rescued by blocking autophagy. Our findings reveal that CIC maintains mitochondrial homeostasis in metabolically active, high proliferating tissues and imply that this protein is a therapeutic target in cancer and likely, in other human diseases.


Figures

Figure 1
Figure 1. CIC is required for tumor proliferation
A. Role of CIC in metabolism (see also text for explanation). CIC catalyzes the electroneutral exchange across the inner mitochondrial membrane of the tricarboxylate citrate plus a proton for the dicarboxylate malate. Once in the cytoplasm citrate is cleaved by citrate lyase (CLY), providing a source for fatty acids (FA) synthesis and producing malate that is imported in the mitochondria. Here, malate oxidation generates NADH, which donates its electrons to the transport chain thereby maintaining oxidative phosphorylation (OXHOPHOS) and mitochondrial membrane potential (MMP). Cytoplasmic citrate can also act as an allosteric inhibitor of Phosphofructokinase-1 (PK1), a key glycolytic enzyme. Glycolysis in the cytoplasm generates a second key substrate, pyruvate that is either converted into lactate to produce ATP in an anaerobic reaction, or it is transported into the mitochondria, converted by Pyruvate Dehydrogenase (PDH) into Acetyl-Coenzyme A, recondensed to citrate, which then supports the Krebs cycle. These activities linked to citrate, should place CIC at a nodal point in regulation of mitochondrial activity and metabolism. B. CIC mRNA expression levels in human normal or breast tumor tissues. Data were obtained from the Oncomine database [49], by selecting a minimal threshold p-value of 0.0005. C. Negative correlation between CIC expression levels and the development of metastatic disease in breast cancer. N indicates the total number of patients. In one study conducted [50], 69 patients with elevated CIC levels were dead after 5 years, versus 158 patients with lower levels, who were still alive. In a second study [51], 18 patients with elevated CIC levels developed metastasis after 5 years, versus 6 with lower CIC levels who remained metastasis free. p values are indicated in each panel. D. CIC expression levels in the breast cancer cell lines indicated at the top of each panel. E-F. Clonogenic assays performed in MBA-MD-231 cells. Cells were transfected with control shRNA vector (indicated as ct), or with vectors harboring three CIC shRNA (shRNA 1, 2, 3), each harboring a puromycin resistance gene. Vectors were transfected individually (panel E) or in different combinations (panel F) and proliferation was assessed after one week of antibiotic selection. Representative CIC expression levels relatively to actin levels are shown in panel E (bottom panel), and representative plates derived from the combination transfection experiments are shown at the bottom of panel F. G. Mitochondrial (m) and cytoplasmic (c) fractions derived from 293T cells transfected with the pcDNA4/TO control vector, or expressing CIC or CIC-DN. The expression levels of CIC and COX IV, used as a mitochondrial marker, are shown.
Figure 2
Figure 2. CIC maintains the intracellular pool of citrate and promotes proliferation
A. Citrate levels (nM/well) were assessed in 293T cell lines harboring the pcDNA/TO vector and treated with either DMSO or with 1 mM BTA, or in cells expressing CIC-DN. Negative values are due to subtraction of background rates. B-C. Dose dependent growth inhibition of BTA in MDA-MB-231 or MCF10A cells. D. Control H1299 cells (pcDNA/TO), or cells expressing the CIC proteins indicated at the bottom of each panel, were treated with DMSO (-), or with 1 mM BTA (+). Cell viability was assessed with trypan blue exclusion. E. Expression of CIC or CIC-DN in tetracycline inducible stable clones of H1299 or 293T cells employed in this study, in presence or absence of tetracycline. F. Female athymic balbc/ nude mice were injected with H1299 cells expressing inducible CIC in the presence or absence of tetracycline or of vehicle control provided in the water. G. 293T cells stably transfected with the control vector (pCDNA4/TO), or expressing inducible CIC-DN were injected in the right and left flanks of female athymic mice, respectively.
Figure 3
Figure 3. CIC is rate-limiting for tumorigenesis in vivo
A. Female athymic balbc/ nude mice were injected with H1299 cells expressing inducible CIC in the presence or absence of tetracycline or of vehicle control as described in Figure 2F and tumor volumes were assessed several weeks after implantation. White bars indicate control group, while black bars show tumor growth in cells expressing CIC. B. Tumor volumes assessed after implantation in nude mice of T293 cells expressing control vector (pCDNA/TO) or dominant negative CIC (CIC-DN). C-E. Tumor volumes in female athymic balbc/ nude mice injected with breast cancer MDA-MB-231 cells (C); with lung cancer H1299 cell lines (D) cells; or with bladder cancer cells derived from T24 cells (E). Tumor volumes derived from mock treated (-) and BTA treated (+) mice are shown. Bars represent standard deviations; asterisk (*) represents p-value <0.05 and double-asterisk (**) represents p-value <0.01.
Figure 4
Figure 4. Mitochondrial and metabolic effects arising from CIC inhibition
A. H1299 cells (panel set indicated as 1), or cells expressing CIC (2) or CIC-DN (3) were stained with anti-CIC (red) or anti-mitochondrial Hsp70 (mHsp70, green) antibodies, and counterstained with DAPI. The DAPI signal is shown only in the merged images. For these experiments cells were harvested 46 hours after tetracycline induction. The arrow in panel A3 indicates mitochondria with enlarged and abnormal morphology (mega-mitochondria). The next set of panels shows measurements of lactate levels (B), of complex I- (C); of mitochondrial membrane potential assessed with a JC1 assay (MMP) (D); of ROS (E); of malate (F); and of isocitrate (G) levels. Measurements were performed in cells treated with DMSO (indicated as control), or with BTA, or expressing CIC or CIC-DN at 16 hours after treatment or tetracycline induction, respectively. In the case of ROS levels, panel D shows a dot plot or red (FL-2) versus green fluorescence (FL-1) of JC1 staining. In mitochondria with intact membrane potential the JC1 dye concentrates into red fluorescent aggregates, while depolarized mitochondria are unable to concentrate the JC1 and exhibit green fluorescence. The percentage of cells with depolarized mitochondrial membrane is shown in bold at the bottom of each panel.
Figure 5
Figure 5. Inhibition of CIC hampers survival during metabolic stress and induces mitochondrial loss via autophagy
A. Cell death was assessed with trypan blue exclusion in cells treated with DMSO or with BTA, in the presence or absence of 5mM methyl-pyruvate or 2 mM NAC. ATP (B) and Oxygen consumption levels (C) in cells cultured in 5 mM glucose and mock treated (DMSO, Control) or treated with BTA, or in cells expressing CIC or CIC-DN, 16 hours after treatments. D. Cell cycle profiles of control H1299 cells, or of cells treated with 1 mM BTA, or expressing the indicated CIC proteins, cultured in either 25 mM (upper panels) or in 2 mM Glucose (bottom panels). The percentage of cells distributed in the G1-, S-, or G2- phases of the cells cycle is shown. Apoptotic cells are identified as the Sub-G1 (SG) population. E. Immuno-fluorescence experiments similar to those described in Figure 4A, were performed in cells expressing epitope tagged Flag-CIC (panels 1 to 3) or Flag-CIC-DN (panels 3 to 6) proteins. Cells were stained with anti-Flag (green, panels 1 and 4) and anti-LC3 (red, panels 2 and 5) antibodies, and counterstained with DAPI. Merged images are shown in panels 3 and 6. Note the intense LC3 staining in the mitochondria of panel 5. The results of these immunofluorescence experiments where confirmed with cellular sub-fractionation experiments shown in F. Cytoplasmic (c) and mitochondrial (m) fractions derived from naïve 293T cells (lanes 1,2) or 293T cells expressing CIC (lanes 3,4) or CIC-DN (lanes 5,6) or treated with BTA (lanes 7,8), were probed with anti-CIC, anti-LC3, or anti-mitofilin antibodies, as indicated. The two arrows in the LC3 blot indicate cytosolic (-I) or activated (-II) LC3 forms. Note the enrichment of LC3-II in the mitochondria of cells expressing CIC-DN or BTA (lanes 6 and 8, respectively). All images shown are derived from the same autoradiogram at identical times of exposures, but lanes in between samples of interest were eliminated. G. Time course (in hours, indicated at the top of each panel) of BTA treated- (lanes 1 to 3) or CIC-DN induced cells (lanes 4 to 6). The anti-mitofilin, anti-p62 (employed as a general autophagic marker), anti-CIC, or anti LC3 specific immuno-blots are shown.
Figure 6
Figure 6. CIC protects from mitochondrial damage and depletion following respiration injury
A. Assessment with NOA staining of mitochondrial mass as a function of time (in hours) in control cells (lanes 1 and 4), or in cells treated with BTA (lanes 2-3 and 5-6) and in the absence (lanes 1-to-3) or presence (lanes 4-to-6) of 5 mM 3MA. Double asterisks refer to p<0.05. Brackets refer to the comparison of values expressed in 3 versus 1, or 3 versus 6. B. Measurement of mitochondrial membrane depolarization with the JC1 assay in the absence (-, lanes 1,3,5) or presence (+, lanes 2,4,6) of 20 micro-M CCCP in the cell lines indicated at the bottom of each panel. The diagram shows histograms of JC1 green fluorescence intensity, indicative of depolarization, derived from a duplicate experiment. C. The H1299 cell lines indicated at the bottom of each panel were left untreated (lanes 1-3) or treated with CCCP (20 micro-M, lanes 4-6) for 16 hours, at which time CCCP was removed from the media. Cells were replenished with fresh media, incubation was carried out for additional 2 hours, after which time cell extracts were probed with the antibodies indicated at the side of each panel. Note the increase in the endogenous CIC levels in CCCP treated versus untreated cells (lane 4 versus lane 1, respectively). The image shown is derived from the same autoradiogram where lanes between the samples of interest were cropped. Panel D shows a quantification of the mitofilin signal. E. Immuno-fluorescence of H1299 cells treated with CCCP for four hours (indicated as time 0, upper panels), or after 24 hours of CCCP wash-out. All panels in this Figure show the merged signals derived from the anti-CIC (red) and anti-Hsp70 (green) staining. Approximately 70% of cells expressing CIC-DN showed the disrupted mitochondrial network even after 24 hours of recovery from CCCP, compared to control H1299 or CIC-expressing cells that displayed this phenotype in less 10% of cells.
Figure 7
Figure 7. The knock-down of CIC in zebrafish results in mitochondrial DNA depletion and activation of autophagy
A. Zebrafish embryos injected with control morpholino (Control MO) or with three different doses of the CIC specific morpholino (CIC MO), resulting in a progressively abnormal phenotypes classified from mild to severe. B. Phenotypes of zebrafish injected with control or CIC MO at 4 days post-development. Images were captured at identical magnification. C. Immuno-blot of pools of 15-30 embryos of each phenotype shown in A, with antibodies listed at the side of each panel. Two different exposures of the CIC-specific immuno-blot are shown. Like in human cell extract, in zebrafish extracts the two main LC3 forms, I and II, could be detected and are indicated by arrows. D. DNA extracted from pooled embryos representative of each phenotype was probed in semi-quantitative PCR by using primers that amplify either 1Kb of mtDNA encompassing the mitochondrial gene NADH-dehydrogenase (NADH-D; top panel), or the nuclear p53 gene (bottom panel). E. Survival of embryos injected with control MO or with CIC-MO grown in media containing (+) or lacking (-) 5 mM 3MA. The percentages of each phenotype classified as normal, slight, severe and dead are indicated by bars of different colors.
Figure 8
Figure 8. CIC maintains mitochondrial homeostasis in tumor cells
The diagram summarizes the findings (see also the Discussion). The mitochondria of tumor cells endure oxidative and respiration stress caused by the nutrient restricted microenvironment, by oncogenic activation, and by altered activity of mitochondrial enzymes. We have shown here that high CIC levels in tumors allows for adaptation to nutritional stress and resistance to mitochondria respiration injury. This protective effect of CIC on the tumor mitochondria relies upon an inhibition of glycolysis, promotion of mitochondrial OXOPHOS and ATP production, and stabilization of the mitochondrial membrane potential (MMP). We have mechanistically linked these activities of CIC to its ability to promote the export of citrate and to maintain adequate levels and flux of other anaplerotic substrates. By contrast, genetic or pharmacologic inhibition of CIC increases ROS levels, compromises respiratory capacity and leads to mitochondrial dysfunction and depletion via autophagy, preventing adaptation to oxidative or respiration stress, and ultimately leading to tumor killing.

Comment in

References

    1. Palmieri F, Pierri CL. Mitochondrial metabolite transport. Essays Biochem. 2010;47:37–52. - PubMed
    1. Nicholls DG. Mitochondrial ion circuits. Essays Biochem. 2010;47:25–35. - PubMed
    1. Palmieri F. Diseases caused by defects of mitochondrial carriers: a review. Biochim Biophys Acta. 2008;1777:564–578. - PubMed
    1. Meechan DW, Maynard TM, Tucker ES, LaMantia AS. Three phases of DiGeorge/22q11 deletion syndrome pathogenesis during brain development: patterning, proliferation, and mitochondrial functions of 22q11 genes. Int J Dev Neurosci. 2011;29:283–294. - PMC - PubMed
    1. Stoffel M, Karayiorgou M, Espinosa R, 3rd, Beau MM. The human mitochondrial citrate transporter gene SLC20A3 maps to chromosome band 22q11 within a region implicated in DiGeorge syndrome, velo-cardio-facial syndrome and schizophrenia. Hum Genet. 1996;98:113–115. - PubMed

MeSH terms