. 2012 Dec 1;189(11):5129-38.
doi: 10.4049/jimmunol.1201570. Epub 2012 Oct 24.

ATP-binding cassette transporter G1 intrinsically regulates invariant NKT cell development

Affiliations

ATP-binding cassette transporter G1 intrinsically regulates invariant NKT cell development

Duygu Sag et al. J Immunol. .

Abstract

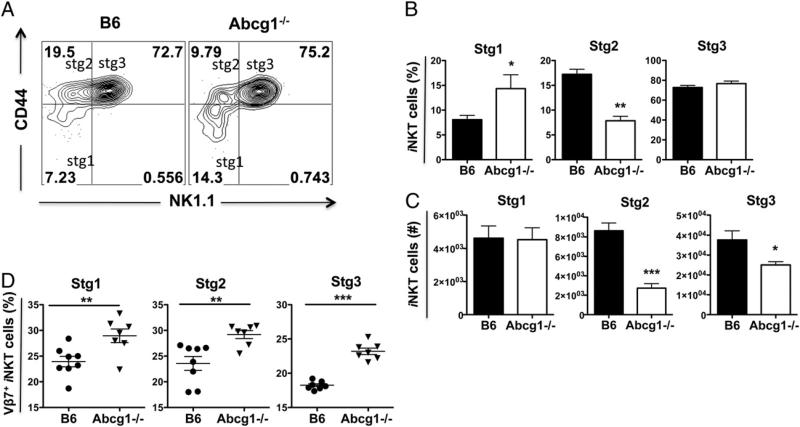
ATP-binding cassette transporter G1 (ABCG1) plays a role in the intracellular transport of cholesterol. Invariant NKT (iNKT) cells are a subpopulation of T lymphocytes that recognize glycolipid Ags. In this study, we demonstrate that ABCG1 regulates iNKT cell development and functions in a cell-intrinsic manner. Abcg1(-/-) mice displayed reduced frequencies of iNKT cells in thymus and periphery. Thymic iNKT cells deficient in ABCG1 had reduced membrane lipid raft content, and showed impaired proliferation and defective maturation during the early stages of development. Moreover, we found that Abcg1(-/-) mice possess a higher frequency of Vβ7(+) iNKT cells, suggesting alterations in iNKT cell thymic selection. Furthermore, in response to CD3ε/CD28 stimulation, Abcg1(-/-) thymic iNKT cells showed reduced production of IL-4 but increased production of IFN-γ. Our results demonstrate that changes in intracellular cholesterol homeostasis by ABCG1 profoundly impact iNKT cell development and function.


Figures

FIGURE 1
FIGURE 1
Abcg1–/– mice display reduced iNKT cell frequencies in thymus and liver. (A) Thymocytes, liver mononuclear cells, and splenocytes from four- to six-week-old wild-type B6 and Abcg1–/– mice (n = 9) were stained with fluorophore-conjugated Abs and CD1d tetramer. Representative contour plots show CD19, CD8α, TCRβ+, CD1d-tetramer+ iNKT cells. Bar graphs show (B) frequency and (C) total cell number of iNKT cells in thymus, liver, and spleen (iNKT cells [%]: % of live cells). Data are pooled from two to three independent experiments (three to five mice per group for each experiment) with similar results. (D) Graph shows the frequency of NRP-1+, CD69iNKT cells in spleen. Representative data of two independent experiments with four-week-old mice (five to six mice per group) are shown. (E) Thymocytes, liver mononuclear cells, and splenocytes from B6 (n = 5) and Abcg1–/– mice (n = 5) were stained with fluorophore-conjugated CD19, CD8α, TCRβ, Vβ7, Vβ8.1/2, and Vβ2 Abs, and CD1d tetramer, and analyzed by flow cytometry. Graphs show frequencies of Vβ7+ (top), Vβ8.1/2+ (middle), and Vβ2+ (bottom) B6 and Abcg1–/– iNKT cells in thymus, liver, and spleen. (F) Graphs show absolute cell numbers of Vβ7+ B6 (n = 4) and Abcg1–/– (n = 4) iNKT cells in thymus, liver, and spleen. Data are representative of two independent experiments. Error bars represent means ± SEM. Asterisks denote the significance of differences between groups (*p < 0.05, **p < 0.01, ***p < 0.001, two-tailed Student t test).
FIGURE 2
FIGURE 2
ABCG1 deficiency affects iNKT cell development via a cell-intrinsic mechanism. (A) Thymocytes from B6 mice (n = 5) and Abcg1–/– mice (n = 4) were stained with CD4, CD8α, and CD1d Abs and analyzed by flow cytometry. Bar graph shows mean fluorescence intensity (MFI) of CD1d on CD4+CD8+ thymocytes from B6 and Abcg1–/– mice. Data are representative of two independent experiments with similar results. (B) iNKT cell hybridoma DN3A4-1.2 cells were cocultured with thymocytes from either B6 (n = 4) or Abcg1–/– (n = 4) mice in the presence of titrated amounts of α-GalCer in vitro. After 18 h, IL-2 production was detected by ELISA. Data are representative of two independent experiments with similar results. (C and D) Bone marrow chimeras were generated by reconstituting irradiated Rag1–/– mice (n = 11) with 1:1 mixed bone marrow cells from CD45.1+ B6.SJL and CD45.2+ Abcg1–/– donor mice. Single-cell suspension from thymus was analyzed by flow cytometry 12 wk following reconstitution. (C) Representative contour plots show CD19, CD8α, TCRβ+, CD1d-tetramer+ iNKT cells, which are gated on CD45.1+ and CD45.2+ to identify Abcg1+/+ B6.SJL and Abcg1–/– iNKT cells, respectively. (D) Bar graph shows percentages of Abcg1+/+ B6.SJL and Abcg1–/– iNKT cells in thymus. Data are pooled from three independent experiments (three to four mice per group for each experiment) with similar results. (E) Graph shows frequency of Vβ7+ CD45.1+ B6 and CD45.2+ Abcg1–/– iNKT cells in thymus. Data are pooled from two independent experiments (three mice per group for each experiment) with similar results (**p < 0.01, ***p < 0.001).
FIGURE 3
FIGURE 3
ABCG1 deficiency affects the maturation of iNKT cells in thymus. Single-cell suspensions from thymi of B6:Abcg1–/– 1:1 mixed chimeric mice (n = 10) were stained with fluorophore-conjugated CD45.1, CD45.2, TCRβ, CD44, NK1.1 Ab, and CD1d tetramer and analyzed by flow cytometry. TCRβ+ and CD1d-tetramer+ cells were further gated to distinguish stage 1 (stg1, CD44low NK1.1), stage 2 (stg2, CD44high NK1.1), and stage 3 (stg3, CD44high NK1.1+) iNKT cells. (A) Representative contour plots. Bar graphs show (B) percentages and (C) absolute cell numbers of CD45.1+ B6 and CD45.2+ Abcg1–/– iNKT cells of indicated maturation stages. Results are representative of two independent experiments with similar results. (D) Graphs show frequencies of Vβ7+ thymic iNKT cells at stage 1–3 in B6 (n = 8) and Abcg1–/– (n = 7) mice. Data are pooled from two independent experiments (three to four mice per group for each experiment) with similar results (*p < 0.05, **p < 0.01, ***p < 0.001).
FIGURE 4
FIGURE 4
Abcg1–/– iNKT cells display reduced proliferation in early stages of development. B6 (n = 7) and Abcg1–/– (n = 8) mice were injected with BrdU three times every 4 h. The next day, thymi were harvested and single-cell suspensions were stained with fluorophore-conjugated CD8α, TCRβ, CD44, NK1.1, BrdU Ab, and CD1d tetramer and analyzed by flow cytometry. TCRβ+ and CD1d-tetramer+ cells were further gated to distinguish stage 1 (stg1, CD44low NK1.1), stage 2 (stg2, CD44high NK1.1), and stage 3 (stg3, CD44high NK1.1+) iNKT cells. (A) Representative contour plots and (B) bar graphs show BrdU incorporation by iNKT cells at each stage. Data are pooled from two independent experiments (three to four mice per group for each experiment) with similar results. (C and D) Thymocytes from B6 (n = 3) and Abcg1–/– (n = 3) mice were cultured overnight and the next day stained with fluorophore-conjugated CD8α, TCRβ, CD44, NK1.1, annexin V Ab, CD1d tetramer, and a live/dead marker and analyzed by flow cytometry. (C) Representative contour plots and (D) bar graphs show percentages of apoptotic (annexin V+ live) iNKT cells at stage 1–3. Data are representative of two independent experiments with similar results (**p < 0.01, ***p < 0.001).
FIGURE 5
FIGURE 5
Abcg1–/– iNKT cells display no change in cholesterol content, but have lower lipid raft content. (A) iNKT cells were FACS sorted from thymus of B6 and Abcg1–/– mice (n = 9; 27 mice, 3 mice were pooled for each sample per group), and free cholesterol (FC), cholesteryl ester (CE), and total cholesterol (TC) were measured by gas chromatography. Data are pooled from three independent experiments (3 samples per group for each experiment) with similar results. (B and C) Thymocytes from B6 (n = 4) and Abcg1–/– (n = 4) mice were stained with fluorophore-conjugated Abs, CD1d tetramer, and CT-B, and analyzed by flow cytometry. (B) Representative plot shows lipid raft staining (CT-B) of iNKT cells in thymus. (C) Graph shows mean fluorescence intensity (MFI) of CT-B of iNKT cells in thymus. Data are representative of two independent experiments with similar results (**p < 0.01).
FIGURE 6
FIGURE 6
Abcg1–/– iNKT cells display reduced IL-4 and increased IFN-γ production following TCR-driven activation. (A and B) Thymocytes from B6:Abcg1–/– 1:1 mixed chimeric mice (n = 8) were stimulated with plate-bound αCD3ε and soluble αCD28 Ab for 4 h in vitro and stained with fluorophore-conjugated surface Abs and CD1d tetramer, followed by intracellular staining with IL-4 and IFN-γ Ab, and analyzed by flow cytometry. (A) Representative contour plots and (B) bar graph show percentages of IL-4– and IFN-γ–producing CD45.1+ B6 and CD45.2+ Abcg1–/– iNKT cells based on CD8, TCRβ+, CD1d-tetramer+ gating. Data are pooled from two independent experiments (4 mice per group for each experiment) with similar results. (C) Thymocytes from B6 (n = 4) and Abcg1–/– (n = 4) mice were stimulated with aCD3ε/αCD28 Abs and analyzed, as described above. Bar graphs show IL-4 (left) and IFN-γ (right) producing stage 1 (stg1, CD44low NK1.1), stage 2 (stg2, CD44high NK1.1), and stage 3 (stg3, CD44high NK1.1+) iNKT cells. (D) Thymocytes from B6 (n = 4) and Abcg1–/– (n = 4) mice were stimulated with PMA/ionomycin for 4 h in vitro and stained with fluorophore-conjugated surface Abs and CD1d tetramer, followed by intracellular staining with IL-4 and IFN-γ Ab, and analyzed by flow cytometry. Bar graph shows percentages of IL-4– and IFN-γ–producing iNKT cells based on CD8, TCRβ+, CD1d-tetramer+ gating. Data are representative of two independent experiments with similar results (*β < 0.05, **p < 0.01, ***p < 0.001).

Similar articles

Cited by

References

    1. Godfrey DI, MacDonald HR, Kronenberg M, Smyth MJ, Van Kaer L. NKT cells: what's in a name? Nat. Rev. Immunol. 2004;4:231–237. - PubMed
    1. Kinjo Y, Wu D, Kim G, Xing GW, Poles MA, Ho DD, Tsuji M, Kawahara K, Wong CH, Kronenberg M. Recognition of bacterial glycosphingolipids by natural killer T cells. Nature. 2005;434:520–525. - PubMed
    1. Mattner J, Debord KL, Ismail N, Goff RD, Cantu C, III, Zhou D, Saint-Mezard P, Wang V, Gao Y, Yin N, et al. Exogenous and endogenous glycolipid antigens activate NKT cells during microbial infections. Nature. 2005;434:525–529. - PubMed
    1. Kinjo Y, Tupin E, Wu D, Fujio M, Garcia-Navarro R, Benhnia MR, Zajonc DM, Ben-Menachem G, Ainge GD, Painter GF, et al. Natural killer T cells recognize diacylglycerol antigens from pathogenic bacteria. Nat. Immunol. 2006;7:978–986. - PubMed
    1. Chang YJ, Kim HY, Albacker LA, Lee HH, Baumgarth N, Akira S, Savage PB, Endo S, Yamamura T, Maaskant J, et al. Influenza infection in suckling mice expands an NKT cell subset that protects against airway hyperreactivity. J. Clin. Invest. 2011;121:57–69. - PMC - PubMed

Publication types

MeSH terms