. 2012 Nov 13;109(46):E3186-95.
doi: 10.1073/pnas.1119964109. Epub 2012 Oct 24.

Differential Ly-6C expression identifies the recruited macrophage phenotype, which orchestrates the regression of murine liver fibrosis

Affiliations

Differential Ly-6C expression identifies the recruited macrophage phenotype, which orchestrates the regression of murine liver fibrosis

Prakash Ramachandran et al. Proc Natl Acad Sci U S A. .

Abstract

Although macrophages are widely recognized to have a profibrotic role in inflammation, we have used a highly tractable CCl(4)-induced model of reversible hepatic fibrosis to identify and characterize the macrophage phenotype responsible for tissue remodeling: the hitherto elusive restorative macrophage. This CD11B(hi) F4/80(int) Ly-6C(lo) macrophage subset was most abundant in livers during maximal fibrosis resolution and represented the principle matrix metalloproteinase (MMP) -expressing subset. Depletion of this population in CD11B promoter-diphtheria toxin receptor (CD11B-DTR) transgenic mice caused a failure of scar remodeling. Adoptive transfer and in situ labeling experiments showed that these restorative macrophages derive from recruited Ly-6C(hi) monocytes, a common origin with profibrotic Ly-6C(hi) macrophages, indicative of a phenotypic switch in vivo conferring proresolution properties. Microarray profiling of the Ly-6C(lo) subset, compared with Ly-6C(hi) macrophages, showed a phenotype outside the M1/M2 classification, with increased expression of MMPs, growth factors, and phagocytosis-related genes, including Mmp9, Mmp12, insulin-like growth factor 1 (Igf1), and Glycoprotein (transmembrane) nmb (Gpnmb). Confocal microscopy confirmed the postphagocytic nature of restorative macrophages. Furthermore, the restorative macrophage phenotype was recapitulated in vitro by the phagocytosis of cellular debris with associated activation of the ERK signaling cascade. Critically, induced phagocytic behavior in vivo, through administration of liposomes, increased restorative macrophage number and accelerated fibrosis resolution, offering a therapeutic strategy to this orphan pathological process.


Conflict of interest statement

The authors declare no conflict of interest.

Figures
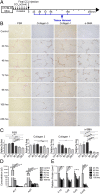
Fig. 1.
Fig. 1.
Experimental liver fibrosis shows distinct phases of fibrogenesis and resolution. (A) Schematic representation of the model of reversible hepatic fibrosis in C57BL/6 mice by 4 wk of two times per week i.p. CCl4 followed by harvest at serial time points after the final injection. Comparisons were made with control (uninjured) animals. (B and C) Histological characterization of hepatic fibrosis and myofibroblast activation by PSR, collagen 1, collagen 3, and α-SMA immunohistochemistry. (B) Representative images are shown for control animals and each time point. (Scale bar: 100 μm.) (C) Quantification of histological changes by morphometric pixel analysis expressed relative to mean percent area of control animals (n = 4 per time point; representative of three independent experiments). (D) Serum ALT and AST levels in control mice and at stated time point after the final CCl4 dose (n = 5–6 per time point from two independent experiments). (E) Whole-liver protein levels of Il-1β, Ccl2, Ccl3, and Cxcl2 measured by multiplex cytokine assay expressed relative to mean protein concentration at the 24-h time point for each (n = 7–9 per time point from two independent experiments). All data shown as mean ± SEM. *P < 0.05, **P < 0.01, ***P < 0.001.
Fig. 2.
Fig. 2.
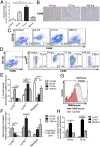
Ly-6Clo macrophages predominate during maximal fibrosis resolution and represent the principle MMP expressing subset. (A–G) Analysis of hepatic macrophages at 24 (inflammation/fibrogenesis), 72 (early and maximal scar resolution), and 168 h (late resolution) after the final CCl4 injection. Comparison was made to control (uninjured) mice. (A) Total hepatic macrophage number quantified by flow cytometry expressed relative to the mean number of macrophages in control liver (n = 8–12 per time point from two independent experiments). (B) F4/80 immunohistochemistry indicates that macrophages localize around areas of scar at 72 h. (Scale bar: 100 μm.) (C) F4/80hi CD11Bint resident Kupffer cells during injury and resolution (representative percentages indicate F4/80hi CD11Bint cells as a proportion of total macrophages). (D) Subset analysis of CD11Bhi F4/80int monocyte-derived macrophages on the basis of differential Ly-6C expression identifies two distinct populations: Ly-6Chi and Ly-6Clo with dynamic changes during injury and resolution (representative percentages indicate each subset as a proportion of total hepatic macrophages). (E) Quantification of Ly-6Chi, Ly-6Clo, and resident macrophage subsets as a proportion of total hepatic macrophage number (n = 10–17 per time point from four independent experiments). (F) Relative number per liver of each macrophage subset at each time point expressed relative to mean total macrophage number in control liver (n = 12–17 per time point from four independent experiments). (G and H) After 4 wk of CCl4, mice were given fluorescent MMP substrate (MMPsense) or vehicle control at 0 or 48 h with harvest at 24 or 72 h, respectively. (G) Identification of MMPsense-positive macrophages at 24 and 72 h by flow cytometry. (H) Macrophage subset analysis of MMPsense-positive macrophage population at 24 and 72 h (n = 3–4). All data shown as mean ± SEM. *P < 0.05, **P < 0.01, ***P < 0.001. Representative flow cytometry plots, histograms, and images are shown.
Fig. 3.
Fig. 3.
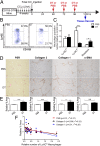
Depletion of CD11B-positive macrophages defines Ly-6Clo cells as being critical for scar resolution. (A) Schematic representation of model of macrophage depletion during fibrosis resolution in CD11B-DTR mice by administration of DT (or PBS control). (B) Flow cytometry data from livers of PBS and DT-treated mice gated on viable CD45+ Ly-6G− CD11Bhi F4/80int hepatic macrophages (representative percentages of each subset as a proportion of total macrophage number shown). (C) Quantification of relative number of each macrophage subset expressed relative to mean total macrophage number in PBS-treated livers (n = 11–13 from two independent experiments). (D) Representative PSR staining and immunohistochemistry of collagen 1, collagen 3, and α-SMA after macrophage depletion or control. (Scale bar: 100 μm.) (E) Quantification of histological changes by pixel analysis expressed relative to mean percent area in PBS-treated liver (n = 10–12 from two independent experiments). (F) Correlation of degree of fibrosis assessed by PSR, collagen 1, and collagen 3 area with the relative number of Ly-6Clo macrophages (n = 22 from two independent experiments). All data shown as mean ± SEM. *P < 0.05, ***P < 0.001. NS, nonsignificant. Representative flow cytometry plots and images are shown.
Fig. 4.
Fig. 4.
Ly-6Clo hepatic macrophages derive from recruited Ly-6Chi monocytes. (A) Schematic representation of the model of adoptive transfer of CD45.1+ Ly-6Chi monocytes (or vehicle control) into C57BL/6 mice (CD45.2+) 4 h after the final CCl4 injection, with livers harvested at 24, 72, and 168 h. (B) Identification of injected CD45.1+ cells in digested livers at 24 and 72 h time points (gating on viable CD45.2− cells). (C) Hepatic CD45.1+ cells have predominantly differentiated into CD11Bhi F4/80int monocyte-derived macrophages. (D) CD45.1+ monocytes have largely formed the restorative Ly-6Clo macrophage subset. (E) Quantification of the proportion of identified CD45.1+ hepatic macrophages forming each of the macrophage subsets (n = 3 per time point). (F) Schematic representation of the model of in situ labeling of circulating Ly-6Clo monocytes by injection of fluorescent latex beads (or vehicle control) 4 h after the final CCl4 injection. (G) Latex-positive macrophages are identified in the liver only at 168 h (gating on viable CD45+ Ly-6G− hepatic macrophages). (H) Latex-positive cells have formed the resident CD11bint F4/80hi macrophage population. (I) Quantification of the proportion of latex-positive cells forming each of the hepatic macrophage subsets at 168 h (expressed as a percent of latex-positive cells; n = 4). (J and K) Ki-67 staining of hepatic macrophages 24, 72, and 120 h after final CCl4 dose after 4 wk of injury. (J) Ki-67–positive macrophages identified by flow cytometry. (K) Percentage of the stated macrophage subset at the indicated time point identified as Ki-67–positive (n = 3–6). All data shown as mean ± SEM. *P < 0.05, ***P < 0.001. Representative flow cytometry plots and proportions are shown.
Fig. 5.
Fig. 5.
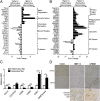
Ly-6Clo macrophages show a gene expression profile favoring scar resolution. (A and B) Microarray analysis of inflammatory Ly-6Chi and restorative Ly-6Clo hepatic macrophage populations isolated by FACS sorting from livers 24 and 72 h after the final CCl4 injection, respectively. (A) Differential regulation of cytokines, chemokines, chemokine receptors, growth factors, and matrix-degrading enzymes between the inflammatory and restorative macrophage populations (expressed as fold change between the two macrophage subsets). (B) Differential expression of opsonins, phagocytosis-related genes, PPAR-γ target genes, and macrophage phenotype markers (M1, classical; M2, alternative) between the macrophage subsets on microarray (expressed as fold change between the two macrophage populations). All microarray data based on n = 3 per group taken from two independent experiments. *P < 0.05, **P < 0.01, ***P < 0.001. (C) Flow cytometric analysis comparing expression of stated marker between inflammatory Ly-6Chi and restorative Ly-6Clo hepatic macrophages. MMPsense was administered 24 h before the time of harvest to compare MMP activity between macrophage subsets expressed relative to average MFI for inflammatory macrophage subset (n = 3–6). MFI, mean fluorescence intensity. *P < 0.05, **P < 0.01. (D) Immunohistochemistry for genes differentially regulated on microarray in murine liver at 24 and 72 h time points and cirrhotic human liver (representative images shown). (Scale bars: 100 μm.)
Fig. 6.
Fig. 6.
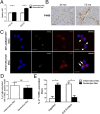
Restorative Ly-6Clo macrophages are postphagocytic. Comparison of inflammatory (24 h Ly-6Chi) and restorative (72 h Ly-6Clo) macrophage subsets after 4 wk of CCl4. (A) Size [forward scatter area (FSC-A)] and complexity [side scatter area (SSC-A)] of macrophage subsets assessed by flow cytometry expressed relative to average MFI for inflammatory macrophages (n = 13 from three independent experiments). (B) F4/80 immunohistochemistry shows larger scar-associated macrophages at 72 h. (Scale bar: 50 μm.) (C–E) TUNEL staining and confocal microscopy of FACS-sorted subsets. (C) Stained DAPI, TUNEL, F4/80, and merged image for macrophage subsets. (Scale bars: 10 μm.) Arrowheads, cell-surface debris; arrows, ingested debris. (D) Percentage of each subset associated with TUNEL-positive nuclei by cell counting (n = 3–4). (E) Percentage of TUNEL-associated macrophages with ingested or cell-surface debris (n = 3–4). Data shown as mean ± SEM. *P < 0.05, **P < 0.01, ***P < 0.001. NS, nonsignificant. Representative images are shown.
Fig. 7.
Fig. 7.
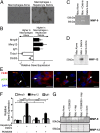
Macrophage phagocytosis in vitro induces a matrix-degrading phenotype through ERK signaling. (A and B) Coculture of BMDMs with hepatocyte debris. (A) Changes in macrophage morphology on phase-contrast microscopy. Hepatocyte debris alone was nonadherent. (B) Changes in macrophage gene expression after coculture expressed relative to mean expression of macrophages alone (n = 11–12 from two independent experiments). (C and D) Coculture of BMDMs with apoptotic thymocytes. (C) Gelatin zymography of culture supernatants equalized for protein content showing active MMP-9 (representative zymogram from n = 4 from two independent experiments). (D) Western blot for MMP-12 on culture supernatants equalized for protein content (representative blot from n = 4 from two independent experiments). (E) Dual immunofluorescence for F4/80 and phospho-ERK in mouse liver 72 h after final CCl4 dose after 4 wk of injury. Arrows, nuclear pERK and F4/80 dual positive cells. (Scale bars: 10 μm.) (F and G). Culture of BMDMs ± MEK1/2 inhibitor (PD98059; 50 μM) ± hepatocyte debris. (F) Changes in macrophage gene expression after coculture expressed relative to mean expression of macrophages alone (n = 6). (G) Casein zymography of culture supernatants equalized for protein content showing active MMP-9 and MMP-12 (representative zymogram from n = 3 shown). Data shown as mean ± SEM. *P < 0.05, **P < 0.01, ***P < 0.001. Representative images are shown.
Fig. 8.
Fig. 8.
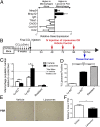
Induction of phagocytic behavior using liposomes enhances the restorative macrophage phenotype in vivo and accelerates fibrosis resolution. (A) Changes in macrophage gene expression after in vitro feeding with liposomes expressed relative to mean expression of unfed macrophages (n = 6). (B) Schematic representation of the model of liposome (or vehicle) administration during resolution phase after 4 wk of CCl4 injury. (C) Changes in hepatic macrophage subsets after liposome administration relative to mean total macrophage number in vehicle-treated livers (n = 13–14). (D) Percentage of each hepatic macrophage subset containing fluorescently labeled liposomes assessed by flow cytometry (n = 8). (E) Fibrosis assessed by PSR staining after liposome (or vehicle) administration. Representative images are shown. (Scale bar: 100 μm.) (F) Quantification of fibrosis by morphometric pixel analysis expressed relative to mean percent area for liposome-treated liver (n = 6). Data shown as mean ± SEM. *P < 0.05, **P < 0.01, ***P < 0.001.
Fig. P1.
Fig. P1.
Generation and action of the restorative macrophage during fibrosis regression. During fibrogenesis, inflammatory monocytes are recruited to the inflamed liver, forming Ly-6Chi profibrotic macrophages. These cells proliferate in situ and produce proteins that drive the inflammatory and fibrogenic response. These cells then phagocytose cellular debris, activating the ERK signaling cascade and forming restorative Ly-6Clo macrophages, which in turn, express molecules that mediate fibrosis regression. Liposome therapy induces phagocytic behavior, increases the number of restorative macrophages, and accelerates the regression of fibrosis.

References

    1. Hayden T. Scarred by disease. Nat Med. 2011;17(1):18–20. - PubMed
    1. Wynn TA. Cellular and molecular mechanisms of fibrosis. J Pathol. 2008;214(2):199–210. - PMC - PubMed
    1. Ramachandran P, Iredale JP. Reversibility of liver fibrosis. Ann Hepatol. 2009;8(4):283–291. - PubMed
    1. Eddy AA. Can renal fibrosis be reversed? Pediatr Nephrol. 2005;20(10):1369–1375. - PubMed
    1. Pickrell JA, Diel JH, Slauson DO, Halliwell WH, Mauderly JL. Radiation-induced pulmonary fibrosis resolves spontaneously if dense scars are not formed. Exp Mol Pathol. 1983;38(1):22–32. - PubMed

Publication types

MeSH terms