. 2013 Jan 1;207(1):152-63.
doi: 10.1093/infdis/jis640. Epub 2012 Oct 24.

Association of a NOD2 gene polymorphism and T-helper 17 cells with presumed ocular toxoplasmosis

Affiliations

Association of a NOD2 gene polymorphism and T-helper 17 cells with presumed ocular toxoplasmosis

Míriam S Dutra et al. J Infect Dis. .

Abstract

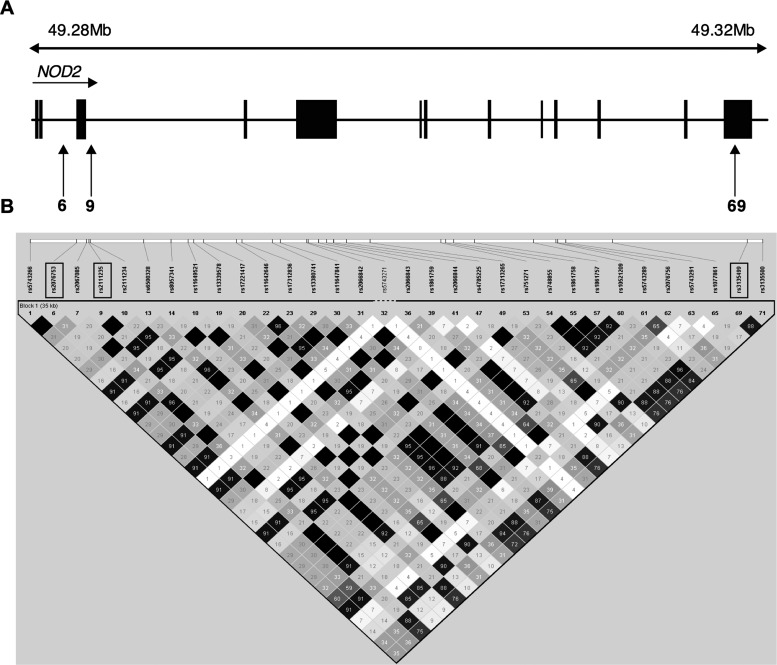
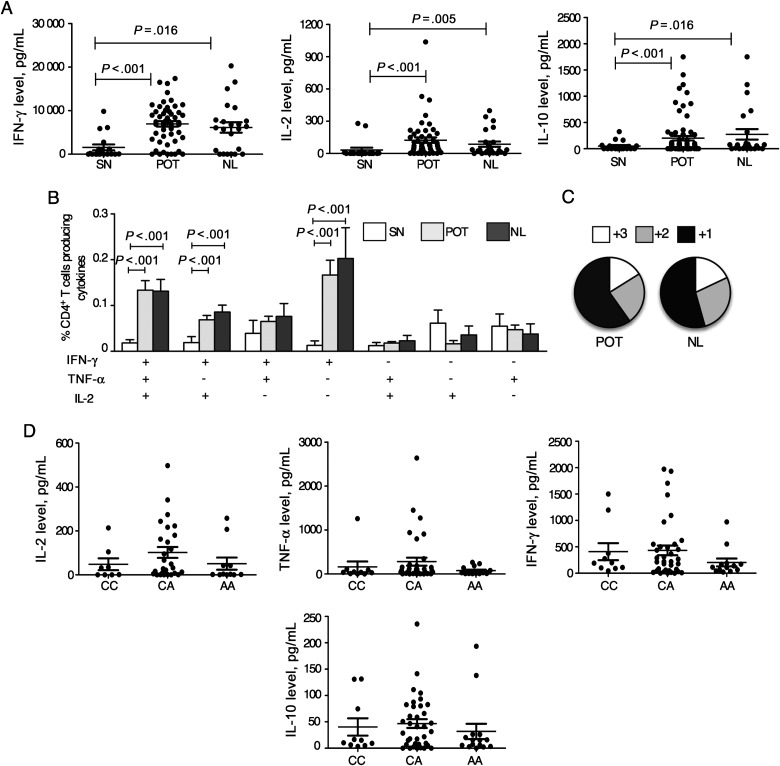
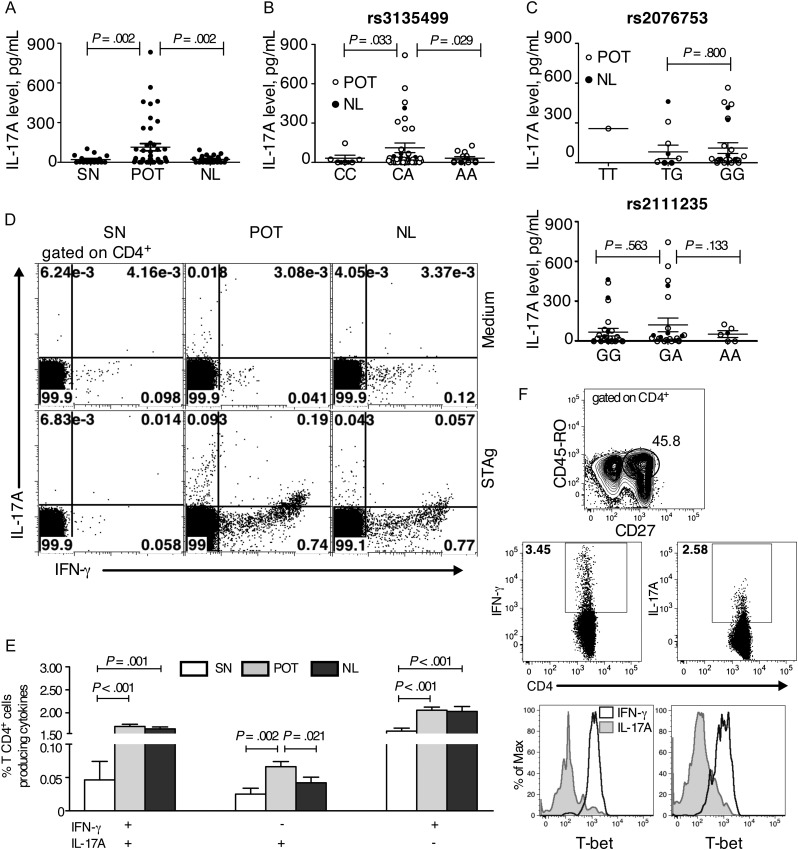
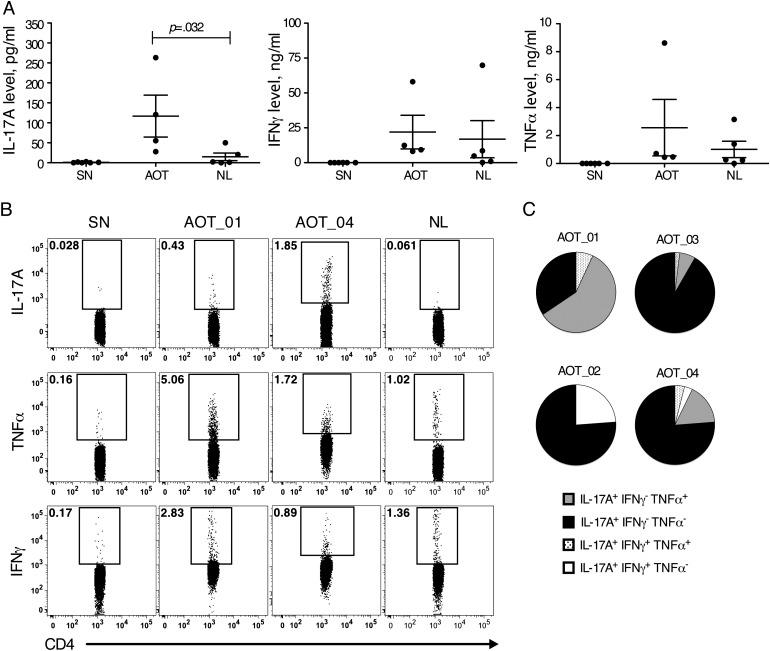
Retinochoroiditis manifests in patients infected with Toxoplasma gondii. Here, we assessed 30 sibships and 89 parent/case trios of presumed ocular toxoplasmosis (POT) to evaluate associations with polymorphisms in the NOD2 gene. Three haplotype-tagging single-nucleotide polymorphisms (tag-SNPs) within the NOD2 gene were genotyped. The family-based association test showed that the tag-SNP rs3135499 is associated with retinochoroiditis (P = .039). We then characterized the cellular immune response of 59 cases of POT and 4 cases of active ocular toxoplasmosis (AOT). We found no differences in levels of interferon γ (IFN-γ) and interleukin 2 produced by T-helper 1 cells when comparing patients with AOT or POT to asymptomatic individuals. Unexpectedly, we found an increased interleukin 17A (IL-17A) production in patients with POT or OAT. In patients with POT or AOT, the main cellular source of IL-17A was CD4(+)CD45RO(+)T-bet(-)IFN-γ(-) T-helper 17 cells. Altogether, our results suggest that NOD2 influences the production of IL-17A by CD4(+) T lymphocytes and might contribute to the development of ocular toxoplasmosis.


Figures

Figure 1.
Figure 1.
Ocular examination in the Minas Gerais cohort. A, A representative retinography of an individual with a type A scarred lesion (arrow), highly suggestive of toxoplasmosis, characterized by sharply demarcated pigmented borders and a hypopigmented central portion with extensive destruction of the retina and choroid. B, A representative retinography of type B scarred ocular lesions (arrows), suggestive of toxoplasmosis, characterized by a hyperpigmented central area surrounded by a hypopigmented halo with smaller degree of tissue destruction. C, Spectral domain optical coherence tomography of an ocular lesion (left), showing disorganization of the retinal layers and thinning of the retina (arrow head, right).
Figure 2.
Figure 2.
Haploview analysis for r2 pairwise measures of linkage disequilibrium between NOD2 single-nucleotide polymorphisms (SNPs) in unrelated family founders in Brazil. A, The NOD2 genomic structure, indicating the position of the 3 genotyped tag-SNPs (vertical arrows). In the diagram, 6 indicates the SNP rs2076753, 9 indicates the SNP rs2111235, and 69 indicates the SNP rs3135499. Exons are represented as black rectangles. B, Linkage disequilibrium plots showing pairwise r2 linkage disequilibrium measures across the 3 NOD2 SNPs genotyped in the study. Linkage disequilibrium estimates were determined in Haploview software v4.2, using unrelated individuals from the Brazilian families. r2 values are represented in white for r2 = 0, with intermediate values for 0 < r2 < 1 indicated by shades of grey. The numbers within the squares represent the r2 scores for pairwise linkage disequilibrium.
Figure 3.
Figure 3.
Unimpaired function of T-helper cell 1 lymphocytes from Toxoplasma gondii–infected individuals bearing the susceptible NOD2 rs3135499 genotype. A, Peripheral blood mononuclear cells (PBMCs) were harvested from seronegative (SN) individuals and patients with chronic toxoplasmosis with ocular scars (POT) or no eye lesions (NL). PBMCs were then cultured for 8 hours in the presence or absence of parasite antigen (STAg), and cytokine levels were measured in the culture supernatants by a cytometric bead array assay. B, PBMCs were cultured for 20 hours in the presence or absence of STAg and stained for CD4 and the cytokines interleukin 2 (IL-2), interferon γ (IFN-γ), and tumor necrosis factor α (TNF-α). Bars represent mean frequencies (±standard error of the mean) of CD4+ T cells producing any of the 7 possible combinations of the cytokines IL-2, IFN-γ, and TNF-α in the SN group (white bars), POT group (grey bars), and NL group (black bars). C, Fraction of the total response comprising cells expressing all 3 cytokines (3), any 2 cytokines (2), or any 1 cytokine (1). D, Production of IFN-γ, IL-2, TNF-α, and interleukin 10 (IL-10) is plotted against the 3 possible genotypes for each of the rs3135499 SNPs for which we found evidence for association with ocular toxoplasmosis.
Figure 4.
Figure 4.
Individuals with the heterozygous genotype for the single-nucleotide polymorphism (SNP) rs3135499 in the NOD2 gene produce higher levels of interleukin 17A (IL-17A) and have a high frequency of Toxoplasma gondii–specific T-helper cell 17 (Th17) lymphocytes. A, Production of IL-17A by antigen-stimulated peripheral blood mononuclear cells (PBMCs) from groups of individuals who were seronegative (SN), had presumed ocular toxoplasmosis (POT), or were asymptomatic (NL). B, Production of IL-17A plotted against the 3 possible genotypes for SNP rs3135499 that we found evidence of an association with ocular toxoplasmosis (P = .039). C, Production of IL-17A plotted against the 3 possible genotypes for the SNPs rs2076753 (top panel) and rs2111235 (bottom panel), both of which were not associated with the ocular disease. Seropositive individuals in the POT and NL groups are presented as white and black dots, respectively. PBMCs from the individuals were stimulated with or without parasite antigen (STAg) for 20 hours and stained either for CD4, IL-17A, and IFN-γ (D and E); or for CD3, CD4, CD45RO, CD27, T-bet, IL-17A, and interferon γ (IFN-γ; F). D, Distribution of CD4+ T cells producing IL-17A, IFN-γ, or both after culture in the absence (top row) or presence (bottom row) of STAg. Each density plot shows concatenated files of 2 SN (left panels), 4 POT (middle panels), and 3 NL (right panels) patients. E, Mean frequencies (±standard error of the mean) of CD4+T cells that produce the possible combinations of IFN-γ and IL-17A. F, Panel on the top shows the CD27+CD45RO+ gate on the CD4+ T lymphocytes and middle panels show IFN-γ–producing CD4+CD27+CD45RO+ and IL-17A–producing CD4+CD27+CD45RO+IL-17A+ T cells in PBMCs from a single subject displaying POT. Bottom panels show representative histograms of T-bet expression in IFN-γ– and IL-17A–producing CD4+CD27+CD45RO+ T cells from 2 of 6 POT patients.
Figure 5.
Figure 5.
Interleukin 17A (IL-17A)–producing CD4+ T cells are also present in a higher frequency in individuals with active ocular toxoplasmosis. A, IL-17A, interferon γ IFN-γ), and tumor necrosis factor α (TNF-α) production by peripheral blood mononuclear cells (PBMCs) from active ocular toxoplasmosis (AOT) lesions cultured in the presence or absence of parasite antigen (STAg). B, Frequencies of antigen-stimulated CD3+CD4+CD45RO+T lymphocytes expressing IL-17A, TNF-α, or IFN-γ from 1 patient in the seronegative group (SN; top panels), 1 in the asymptomatic group (NL; bottom panels), or 2 in the AOT group (AOT_01 and AOT_04; middle panels). C, Distribution of subgroups of IL-17A–producing CD4+ T lymphocytes expressing the 4 different sets of cytokines, combining TFN-α, IFN-γ, and IL-17A in 4 patients with AOT. The proportions of CD4+CD45RO+ T lymphocytes that are IL-17A+IFN-γ+TNF-α+, IL-17A+IFN-γTNF-α, IL-17A+IFN-γ+TNF-α, and IL-17A+IFN-γTNF-α+ are represented in dotted pattern, black, white and grey, respectively.

References

    1. Weiss LM, Dubey JP. Toxoplasmosis: a history of clinical observations. Int J Parasitol. 2009;39:895–901. - PMC - PubMed
    1. Olariu TR, Remington JS, McLeod R, Alam A, Montoya JG. Severe congenital toxoplasmosis in the United States: clinical and serologic findings in untreated infants. Pediatr Infect Dis J. 2011;30:1056–61. - PubMed
    1. Holland GN. Ocular toxoplasmosis: a global reassessment. Part II: disease manifestations and management. Am J Ophthalmol. 2004;137:1–17. - PubMed
    1. Portela RW, Bethony J, Costa MI, et al. A multihousehold study reveals a positive correlation between age, severity of ocular toxoplasmosis, and levels of glycoinositolphospholipid-specific immunoglobulin A. J Infect Dis. 2004;190:175–83. - PubMed
    1. Glasner PD, Silveira C, Kruszon-Moran D, et al. An unusually high prevalence of ocular toxoplasmosis in southern Brazil. Am J Ophthalmol. 1992;114:136–44. - PubMed

Publication types

MeSH terms