

Occupational exposure assessment in carbon nanotube and nanofiber primary and secondary manufacturers: mobile direct-reading sampling
- PMID: 23100605
- PMCID: PMC4557693
- DOI: 10.1093/annhyg/mes079
Occupational exposure assessment in carbon nanotube and nanofiber primary and secondary manufacturers: mobile direct-reading sampling
Abstract
RESEARCH SIGNIFICANCE: Toxicological evidence suggests the potential for a wide range of health effects from exposure to carbon nanotubes (CNTs) and carbon nanofibers (CNFs). To date, there has been much focus on the use of direct-reading instruments (DRIs) to assess multiple airborne exposure metrics for potential exposures to CNTs and CNFs due to their ease of use and ability to provide instantaneous results. Still, uncertainty exists in the usefulness and interpretation of the data. To address this gap, air-monitoring was conducted at six sites identified as CNT and CNF manufacturers or users and results were compared with filter-based metrics.
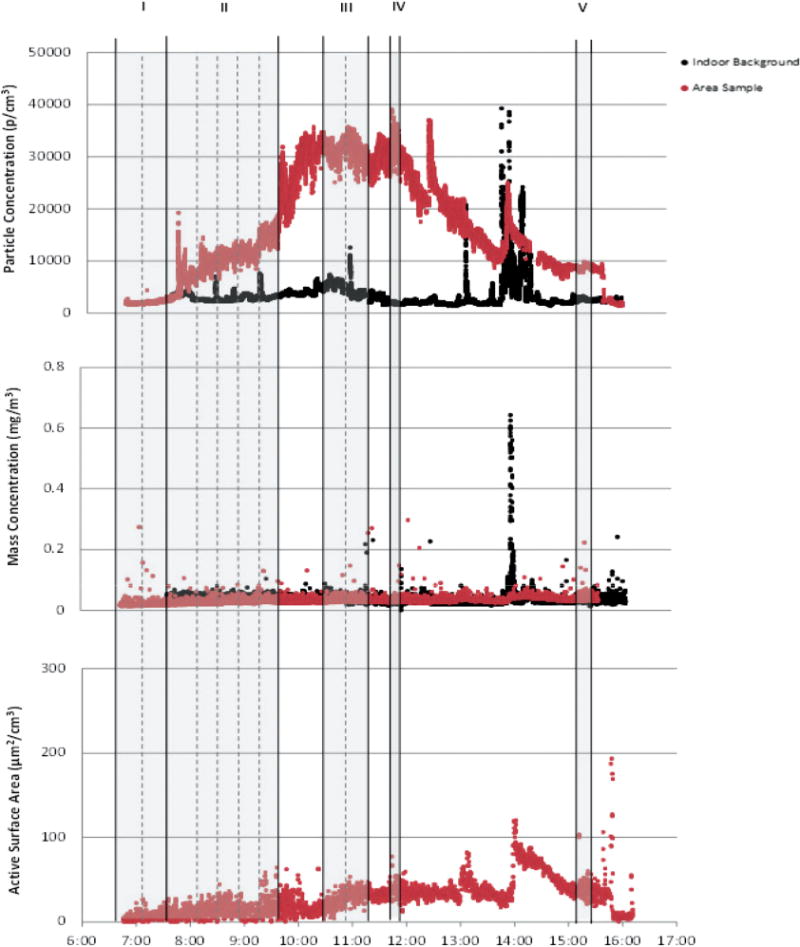
Methods: Particle number, respirable mass, and active surface area concentrations were monitored with a condensation particle counter, a photometer, and a diffusion charger, respectively. The instruments were placed on a mobile cart and used as area monitors in parallel with filter-based elemental carbon (EC) and electron microscopy samples. Repeat samples were collected on consecutive days, when possible, during the same processes. All instruments in this study are portable and routinely used for industrial hygiene sampling.
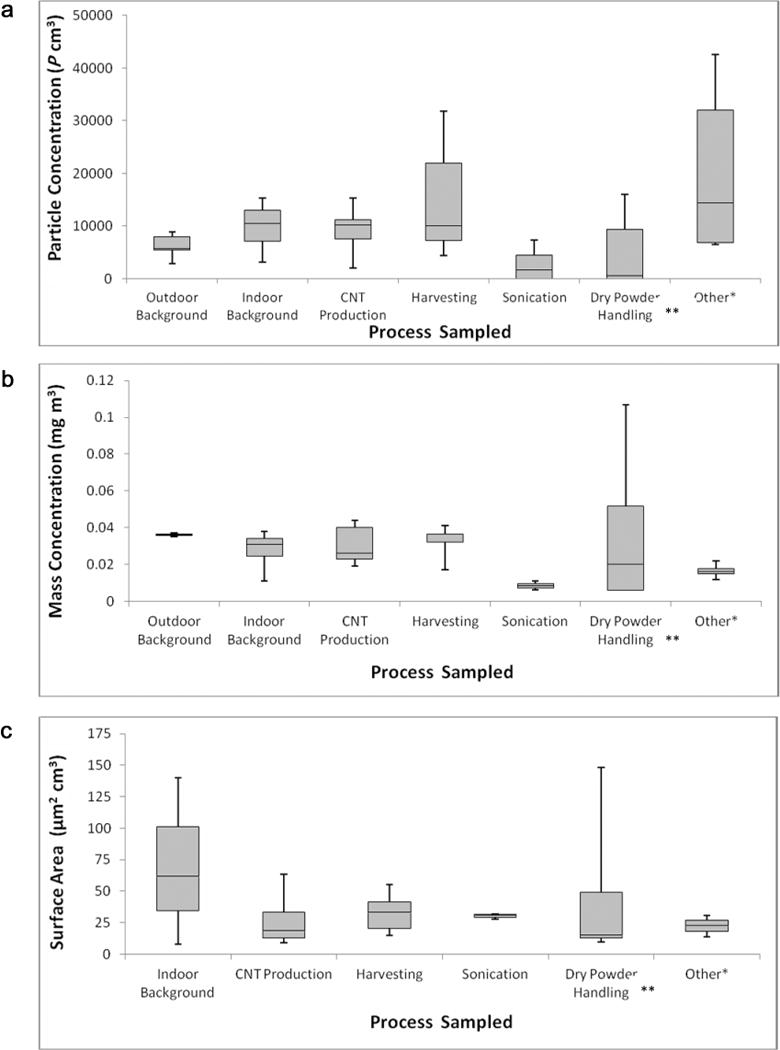
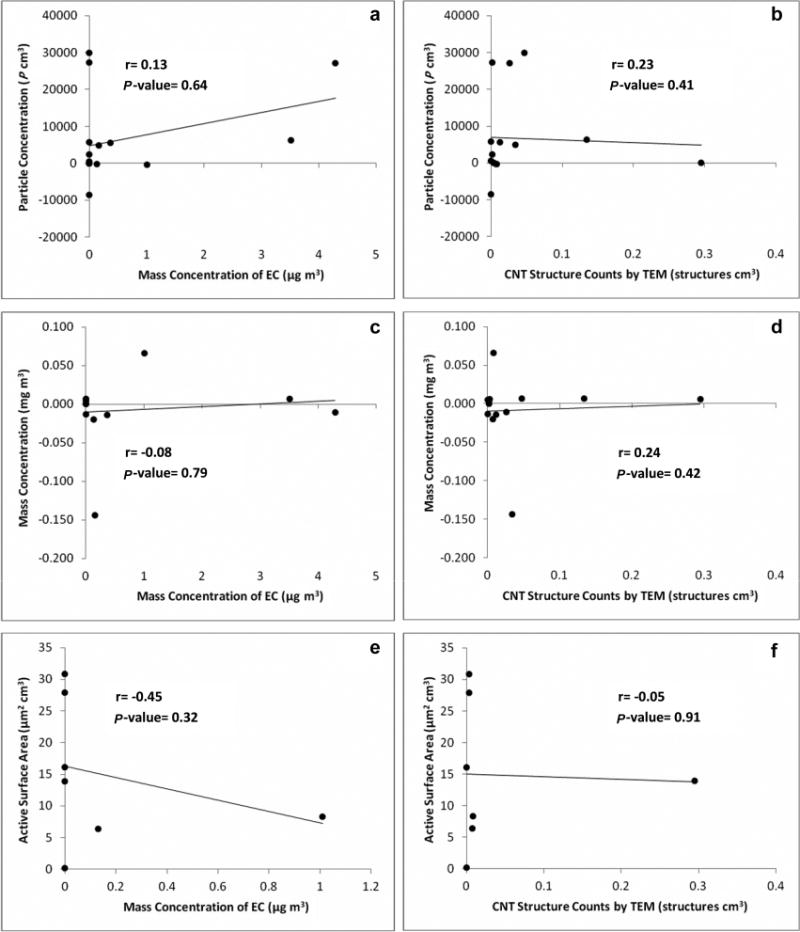
Results: Differences were not observed among the various sampled processes compared with concurrent indoor or outdoor background samples while examining the different DRI exposure metrics. Such data were also inconsistent with results for filter-based samples collected concurrently at the same sites [Dahm MM, Evans DE, Schubauer-Berigan MK et al. (2012) Occupational exposure assessment in CNT and nanofiber primary and secondary manufacturers. Ann Occup Hyg; 56: 542-56]. Significant variability was seen between these processes as well as the indoor and outdoor backgrounds. However, no clear pattern emerged linking the DRI results to the EC or the microscopy data (CNT and CNF structure counts).
Conclusions: Overall, no consistent trends were seen among similar processes at the various sites. The DRI instruments employed were limited in their usefulness in assessing and quantifying potential exposures at the sampled sites but were helpful for hypothesis generation, control technology evaluations, and other air quality issues. The DRIs employed are nonspecific, aerosol monitors, and, therefore, subject to interferences. As such, it is necessary to collect samples for analysis by more selective, time-integrated, laboratory-based methods to confirm and quantify exposures.
Figures
References
-
- Asbach C, Kaminski H, von Barany D, et al. Comparability of portable nanoparticle exposure monitors. Ann Occup Hyg. 2012;56:606–21. - PubMed
-
- Bello D, Hart JA, Ahn K, et al. Particle exposure levels during CVD growth and subsequent handling of vertically aligned carbon nanotube films. Carbon. 2008;46:974–81.
-
- Bello D, Wardle BL, Yamamoto N, et al. Exposure to nanoscale particles and fibers during machining of hybrid advanced composites containing carbon nanotubes. J Nanopart Res. 2009;11:231–49.
-
- Bello D, Wardle BL, Zhang J, et al. Characterization of exposures to nanoscale particles and fibers during solid core drilling of hybrid carbon nanotube advanced composites. Int J Occup Environ Health. 2010;16:434–50. - PubMed
MeSH terms
Substances
Grants and funding
LinkOut - more resources
Full Text Sources
Medical
Miscellaneous
