. 2012 Oct 26;151(3):619-29.
doi: 10.1016/j.cell.2012.09.017.

Membrane shape at the edge of the dynamin helix sets location and duration of the fission reaction

Affiliations

Membrane shape at the edge of the dynamin helix sets location and duration of the fission reaction

Sandrine Morlot et al. Cell. .

Abstract

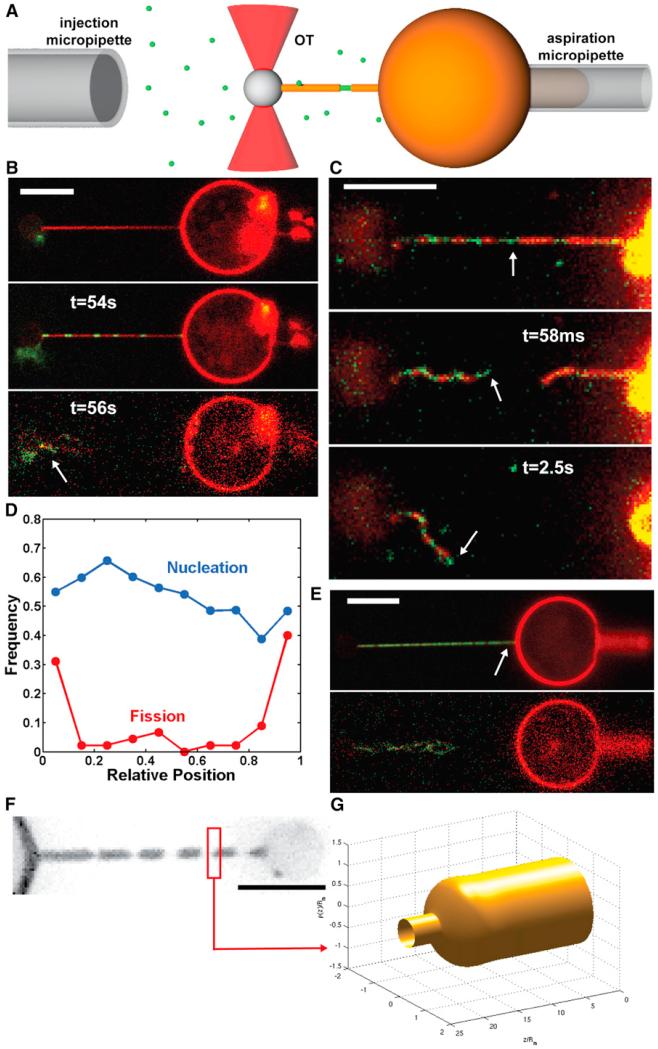
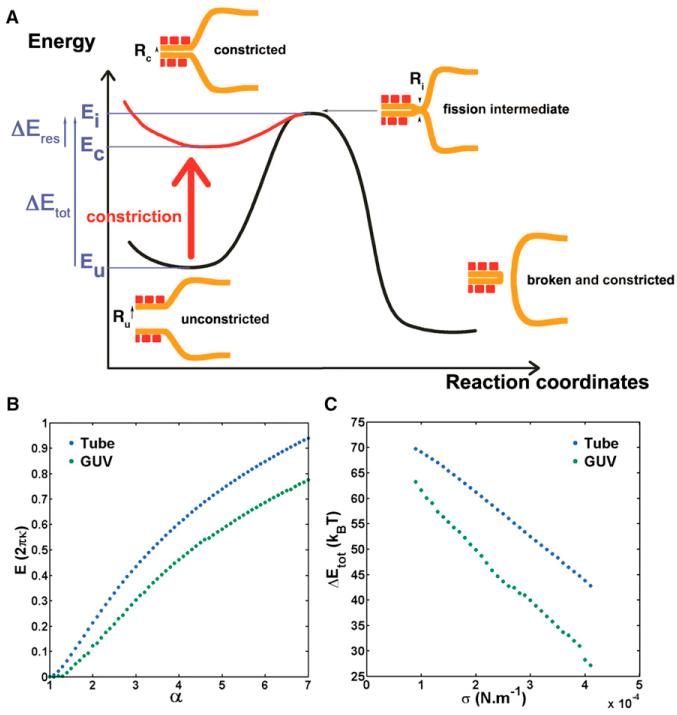
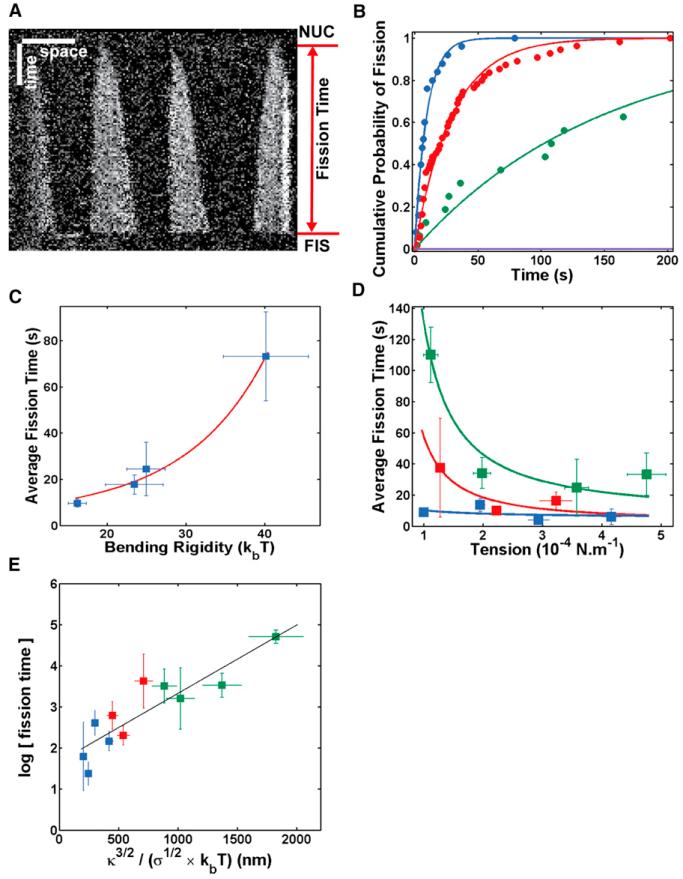
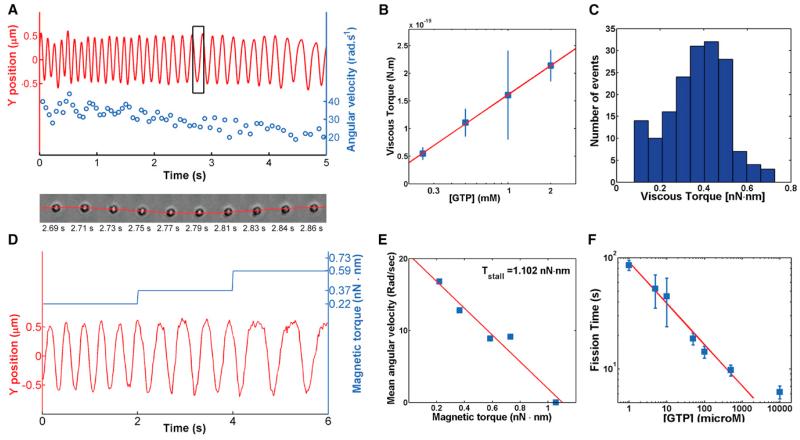
The GTPase dynamin polymerizes into a helical coat that constricts membrane necks of endocytic pits to promote their fission. However, the dynamin mechanism is still debated because constriction is necessary but not sufficient for fission. Here, we show that fission occurs at the interface between the dynamin coat and the uncoated membrane. At this location, the considerable change in membrane curvature increases the local membrane elastic energy, reducing the energy barrier for fission. Fission kinetics depends on tension, bending rigidity, and the dynamin constriction torque. Indeed, we experimentally find that the fission rate depends on membrane tension in vitro and during endocytosis in vivo. By estimating the energy barrier from the increased elastic energy at the edge of dynamin and measuring the dynamin torque, we show that the mechanical energy spent on dynamin constriction can reduce the energy barrier for fission sufficiently to promote spontaneous fission. :


Figures

Figure 1
Figure 1. Localization of Fission Events at Dynamin-Membrane Edges
(A) Schematic drawing of the experimental set-up. A micropipette (right) set the GUV’s tension. A membrane nanotube is extracted from the GUV via a microbead trapped in optical tweezers (red cones). A second micropipette (left) injects locally dynamin and GTP. (B) Confocal pictures of a GUV labeled with BodipyTMR-PI(4,5)P2 (red channel) and dynamin labeled with Alexa 488 (green channel); see also Movie S1. Top: Membrane nanotube before injection of dynamin + GTP. Middle: Nanotube partially coated with dynamin after injection of dynamin + GTP. Bottom: Fission 56 s after start of polymerization. Remaining tube is still attached to the bead (white arrow). Scale bars, 5 μm. (C) Images from dual-color spinning disk confocal microscopy. Top: tube before fission. Middle: Same tube 58 ms after fission. Bottom: Same tube 2.5 s after fission. After fission, extremity of the left stump is covered with green dynamin, whereas the right stump is uncoated, showing that fission occurred at the edge between a seed of dynamin (white arrows) and the dynamin-free membrane nanotube (see also Figure S1 and Movie S2). Scale bars, 5 μm. (D) Frequency of dynamin nucleation (blue) and fission (red) along the nanotube. Position is normalized so that 0 and 1 are, respectively, the bead boundary and the connection between the tube and the GUV. N = 44 tubes. (E) Confocal pictures of a GUV and a dynamin-coated nanotube as shown in (B) (see also Movie S3). Nothing remaining of the tube is seen on the GUV, showing that fission occurred at the connection between the tube and the GUV (white arrow). Scale bars, 5 μm. (F) Fluorescence image of a membrane tube constricted by dynamin in presence of GTP (TMRPE). Scale bars, 5 μm. (G) Calculated shape a single dynamin-membrane edge by simulations.
Figure 2
Figure 2. Energy Landscape of Dynamin-Mediated Fission
(A) Mechanism and associated energy landscape for dynamin-mediated fission reaction. Intermediate state corresponds to hemifission, in agreement with experiments using lysolipids shown in Figure S2. (B) Energy of the neck joining the bare membrane tube with the dynamin-coated tube (blue) and energy of the neck joining a GUV or bead to a dynamin-coated tube (green) as a function of α = Rm/Rc with Rm as the radius of the dynamin-free tube and Rc as the radius of the constricted dynamin-coated tube. (C) Total energy barrier for fission within the lipid tube (blue) or in the GUV-dynamin or bead-dynamin edge (green) as a function of tension for κ = 16 kBT and Ri = 3nm, Ru = 10 nm.
Figure 3
Figure 3. Kinetics of Dynamin Fission
(A) Kymograph. Fluorescence of Alexa488-dynamin along a membrane tube as a function of time. Dynamin polymerizes from four initial nucleation seeds until fission occurs. Fission time is measured as the time elapsed between start of polymerization (NUC) and fission (FIS). Here, tf = 168 s. (B) Cumulative probability of fission at four different conditions: [GTP] = 500 μM (blue); [GTP] = 5 μM (red); [GTP] = 375 μM + [GTPγS] = 125 μM (green); and [GTP] = 250 μM + [GTPγS] = 250 μM (purple). Circles, experimental points. Line, exponential fit 1−exp(−t/τ). The fitted parameters, τ, for different GTP concentrations are listed in Table S1. Scale bars: horizontal, 5 μm; vertical, 30 s. (C) Bending rigidity dependence of fission time. Blue squares and bars: experimental points, average + SEM. Red line: y = a*exp(bx3/2). Different lipid compositions are used to obtain different bending rigidities; see Table S2. (D) Tension dependence of fission time. Blue: κ = 16.2 ± 1.2 kT [EggPC+PI(4,5)P2]. Red: κ = 25.0 ± 2.4kT [EggPC + Cholesterol + PI(4,5)P2]. Green: κ = 44.8 ± 5.1kT [Sphingomyelin+PI(4,5)P2]. Squares and bars: experimental points, average + SEM. Lines, y = a*exp(b/x0.5). (E) Relationship between the log of fission time and κ3/21/2. Same color code as in (D). Squares and bars: experimental points, average + SEM. As predicted by our model, we observed a linear dependence (black line), linear fit: y = a*x+b, a = 1.17 ± 0.42 106, b = 0.59 ± 0.27, R2 = 0.82.
Figure 4
Figure 4. Torque Measurements
(A) Top: Y-position trace (red) and corresponding angular velocity values (blue) of a bead rotating around a membrane tube induced through dynamin twisting upon GTP hydrolysis. Bottom: Sequence of 10 frames of the bead performing exactly one rotation corresponding to the black rectangle. See also Movie S4. (B) Linear dependence of the viscous torque with the log of the GTP concentration. Blue squares and bars: experimental points, average + SEM. Red line: linear fit, y = a*x+b, a = 1.43 ± 1.00 10−19, b = 9.80 ± 3.70 10−20, R2 = 0.95. (C) Histogram of viscous torques measured from the fastest bead, as shown in Movie S4. (D) Position relative to the axis of the tube of a magnetic, 695-nm radius streptavidin-coated bead rotating after addition of 1 mM GTP, and under the magnetic torque (blue; see text for explanations) generated by a magnetic field. The bead slows down as magnetic torque increases; see also Figure S3. (E) Velocity of a rotating bead as the function of the magnetic torque. Bead stops at 1.1 nN.nm. See also Movie S5. (F) [GTP]-dependence of fission time. Blue squares and bars: experimental points, average + SEM. Red line: linear fit, y = a*x+b, a = −0.37 ± 0.07, b = 4.51 ± 0.27, R2 = 0.98.
Figure 5
Figure 5. Block of Fission of CCPs by Hypertonic Shock
(A) COS-7 cells transfected with mCTLA-mCherry before and after hypertonic shock; resulting kymograph that follows the time course before and after hypertonic shock. (B) COS-7 cells transfected with DNM2-GFP before and after hypertonic shock; resulting kymograph that follows the time course before and after hypertonic shock. Scale bar, 5 μm; time scale, 5 s. see also Movie S6. (C) Colocalization of mCTLA-mCherry (red) and DNM2-GFP (green) in COS-7 cells after hypertonic shock; see also Figure S4. (D) Colocalization of mCTLA-GFP (green) and transferrin (red) in COS-7 cells after hypertonic shock. (E) Colocalization of mCTLA-GFP (green) and plasma membrane (red) in COS-7 cells after hypertonic shock. Scale bar, 1 μm.

References

    1. Angelova MI, Soléau S, Méléard P, Faucon JF, Bothorel P. Preparation of giant vesicles by external AC electric fields. Kinetics and applications. Prog. Colloid Polym. Sci. 1992;89:127–131.
    1. Bashkirov PV, Akimov SA, Evseev AI, Schmid SL, Zimmerberg J, Frolov VA. GTPase cycle of dynamin is coupled to membrane squeeze and release, leading to spontaneous fission. Cell. 2008;135:1276–1286. - PMC - PubMed
    1. Bleazard W, McCaffery JM, King EJ, Bale S, Mozdy A, Tieu Q, Nunnari J, Shaw JM. The dynamin-related GTPase Dnm1 regulates mitochondrial fission in yeast. Nat. Cell Biol. 1999;1:298–304. - PMC - PubMed
    1. Boulant S, Kural C, Zeeh J-C, Ubelmann F, Kirchhausen T. Actin dynamics counteract membrane tension during clathrin-mediated endocytosis. Nat. Cell Biol. 2011;13:1124–1131. - PMC - PubMed
    1. Chappie JS, Mears JA, Fang S, Leonard M, Schmid SL, Milligan RA, Hinshaw JE, Dyda F. A pseudoatomic model of the dynamin polymer identifies a hydrolysis-dependent powerstroke. Cell. 2011;147:209–222. - PMC - PubMed

Publication types