. 2012 Oct 26;151(3):645-57.
doi: 10.1016/j.cell.2012.09.020.

GABAergic RIP-Cre neurons in the arcuate nucleus selectively regulate energy expenditure

Affiliations

GABAergic RIP-Cre neurons in the arcuate nucleus selectively regulate energy expenditure

Dong Kong et al. Cell. .

Abstract

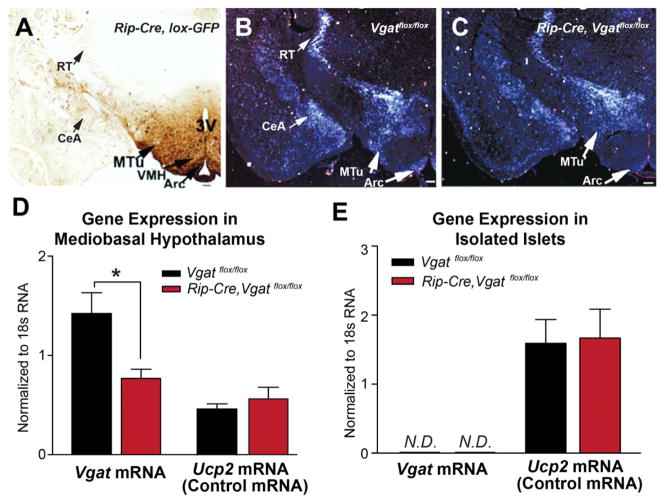
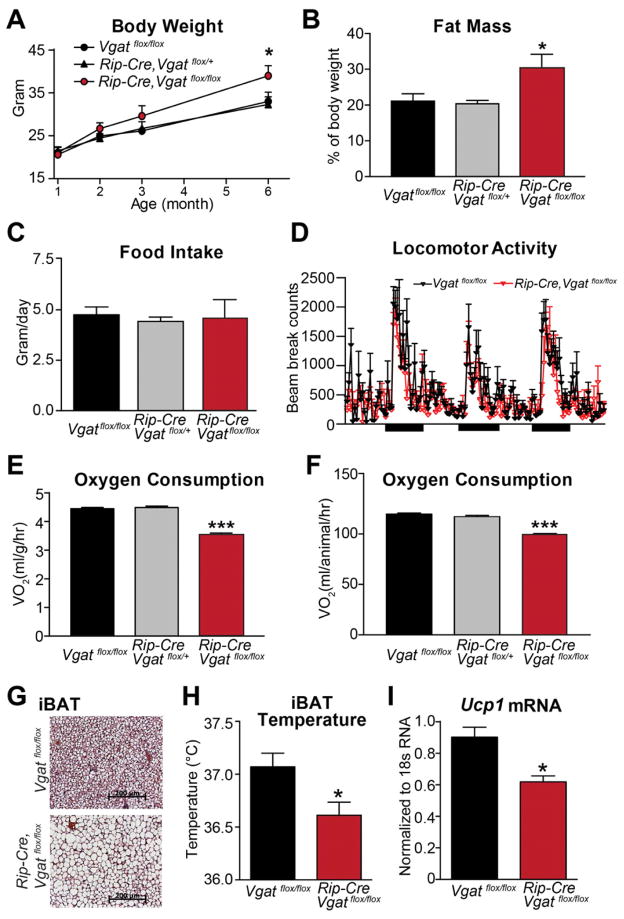
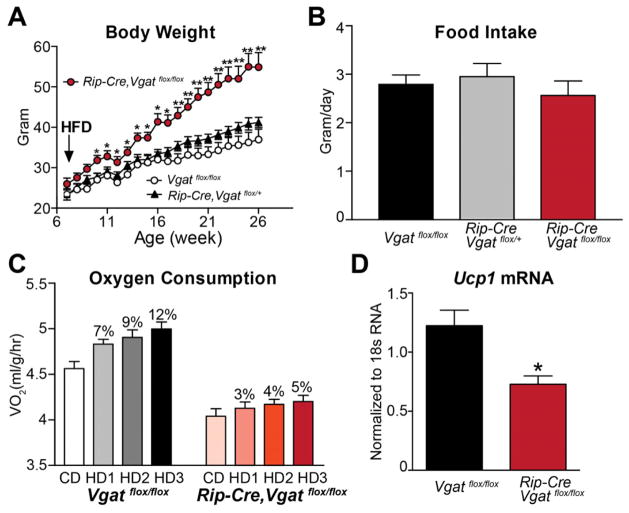
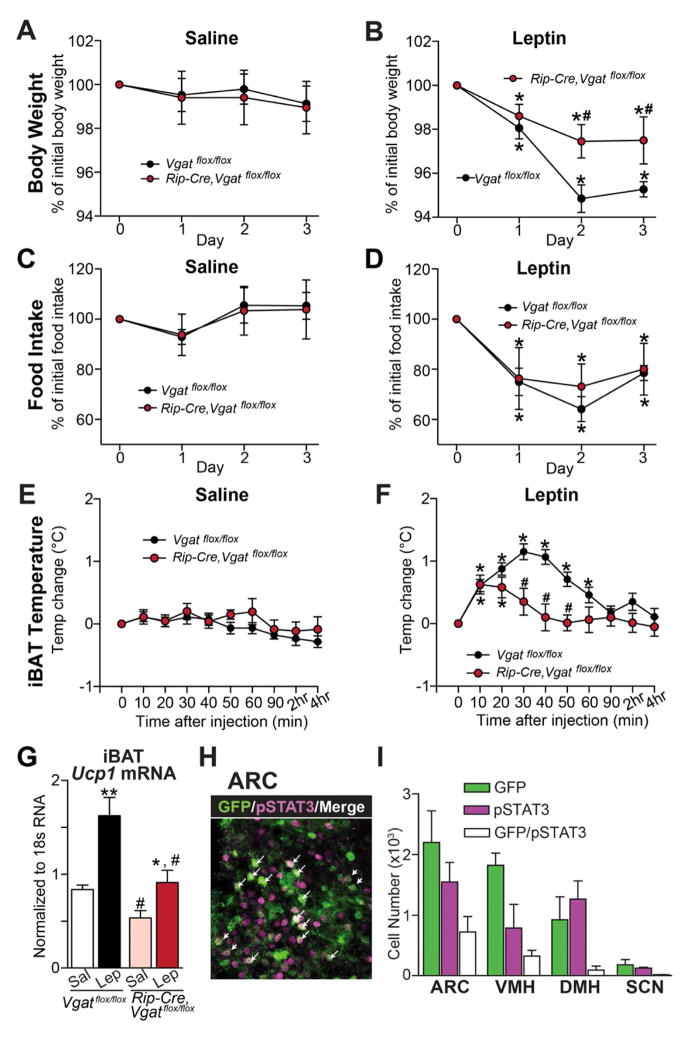
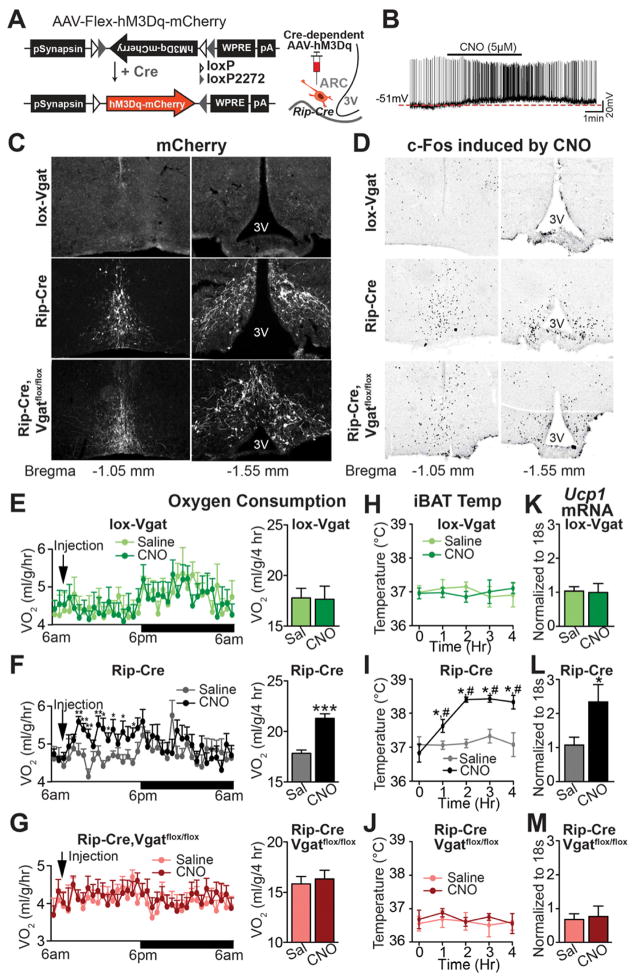
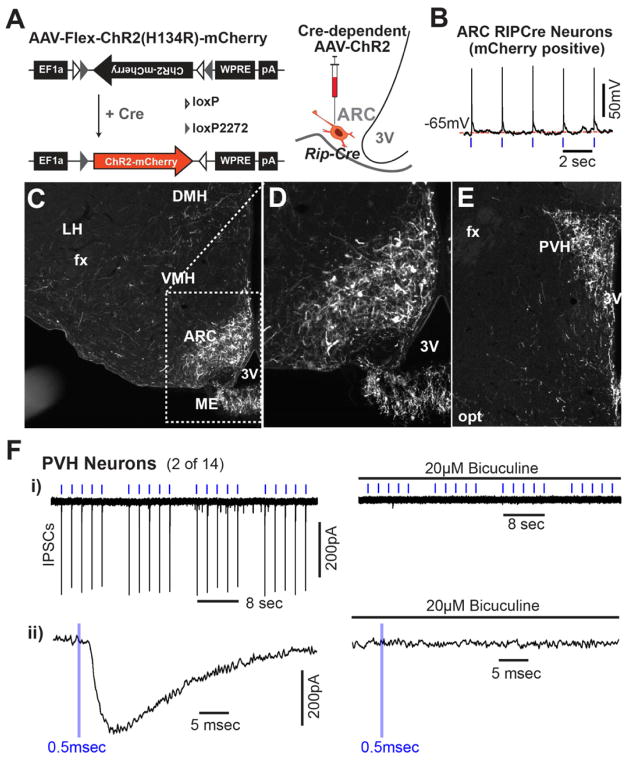
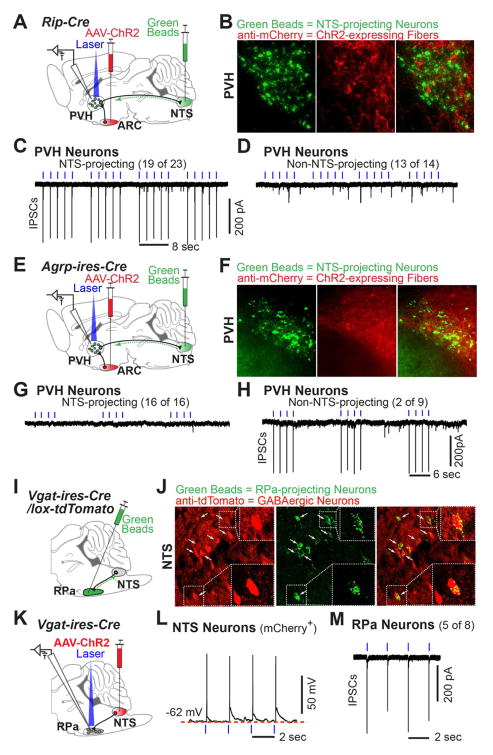
Neural regulation of energy expenditure is incompletely understood. By genetically disrupting GABAergic transmission in a cell-specific fashion, and by combining this with selective pharmacogenetic activation and optogenetic mapping techniques, we have uncovered an arcuate-based circuit that selectively drives energy expenditure. Specifically, mice lacking synaptic GABA release from RIP-Cre neurons have reduced energy expenditure, become obese and are extremely sensitive to high-fat diet-induced obesity, the latter due to defective diet-induced thermogenesis. Leptin's ability to stimulate thermogenesis, but not to reduce feeding, is markedly attenuated. Acute, selective activation of arcuate GABAergic RIP-Cre neurons, which monosynaptically innervate PVH neurons projecting to the NTS, rapidly stimulates brown fat and increases energy expenditure but does not affect feeding. Importantly, this response is dependent upon GABA release from RIP-Cre neurons. Thus, GABAergic RIP-Cre neurons in the arcuate selectively drive energy expenditure, contribute to leptin's stimulatory effect on thermogenesis, and protect against diet-induced obesity.


Figures

Figure 1
Figure 1. Generation of Mice Lacking VGAT in RIP-Cre Neurons
(A) Immunodetection of GFP in the brain of Rip-Cre, lox-GFP mice. 3V, third ventricle; VMH, ventromedial hypothalamus; MTu, medial tuberal nucleus; Arc, arcuate nucleus; RT, reticular nucleus of thalamus; CeA, central amygdala. (B, C) in situ hybridization for Vgat mRNA in the brain of (B) control (Vgatflox/flox) and (C) Rip-Cre, Vgatflox/flox littermates. Arrows indicate the regions with notable reduction of Vgat mRNA signal in Rip-Cre, Vgatflox/flox mice. (D, E) Quantitative PCR results of Vgat mRNA in (D) mediobasal hypothalamus and (E) isolated pancreatic islets of 2-month old littermates (mean ± SEM; n=4). N.D., non-detectable. *p< 0.05, unpaired t-tests. See also Table S1.
Figure 2
Figure 2. Energy Balance in Mice Lacking VGAT in Rip-Cre Neurons
(A) Body weight, (B) body fat mass (3-month old), (C) daily food intake (2-month old), and (D) locomotor activity (2-month old) of ad libitum chow-fed male littermates. (n=8–10). Black bars in (D) indicate dark cycles. (E, F) Oxygen consumption of 2-month old male littermates expressed (E) per body weight and (F) per animal (n=8). (G) H&E staining of brown adipose tissue from 2-month old littermates. (H, I) (H) Temperature (n=12) and (I) Ucp1 mRNA expression (n=4) in iBAT. Data are presented as mean ± SEM. *p< 0.05 and ***p<0.001, unpaired t-test compared with Vgatflox/flox group. See also Figure S1 and S2.
Figure 3
Figure 3. Diet-induced Obesity in Mice Lacking VGAT in RIP-Cre Neurons
(A) Body weight on HFD and (B) daily food intake averaged over the first two weeks on HFD (n=8–10). (C) Oxygen consumption expressed per body weight during the transition from chow to HFD (n=8). CD = Averaged oxygen consumption over 3 days on chow. HD1, HD2 and HD3 = oxygen consumption during day 1, 2 and 3, respectively, on HFD. The percentage increase in oxygen consumption on HFD above that on chow diet is indicated above each bar. (D) Ucp1 mRNA level in iBAT of HFD-treated littermates (n=6–8). Data are presented as mean ± SEM. *p< 0.05 and **p<0.01, unpaired t-test compared with Vgatflox/flox group.
Figure 4
Figure 4. Response to Leptin in Mice Lacking VGAT in RIP-Cre Neurons
(A–F) The effects of saline or leptin on (A, B) body weight, (C, D) daily food intake, and (E, F) iBAT temperature in 2-month old male littermates (n=8–12). *p<0.05, paired t-test compared with animals of the same genotype before leptin injection (i.e. Timepoint 0); #p<0.05, unpaired t-test compared with control animals at given time point. (G) Ucp1 mRNA level in iBAT 4 hours after saline or leptin injection (n=6). *p<0.05 and **p<0.01, unpaired t-test compared with saline-injected animals of the same genotype; #p<0.05, unpaired t-test compared with Vgatflox/flox animals of the same treatment. (H) Double immunohistochemistry for GFP (green) and leptin-induced phosphorylation of STAT3 (Tyr105, pSTAT3, magenta) in the ARC of Rip-Cre, lox-GFP mice. Arrows indicate the neurons with coexpression of GFP and pSTAT3. (I) Quantification of the neurons that expressed GFP, pSTAT3, or both in the hypothalamic nuclei (n=3 mice). Data are presented as mean ± SEM. See also Figure S3 and S5.
Figure 5
Figure 5. Pharmacogenetic Activation of ARC RIP-Cre Neurons
(A) Diagram of AAV-Flex-hM3Dq-mCherry (left) and schematic indication of the stereotaxic injection into the ARC of Rip-Cre transgenic mice (right). (B) Representative whole cell, current-clamp recording from an ARC RIP-Cre neuron marked by mCherry fluorescence from a Rip-Cre, lox-GFP mouse injected with AAV-Flex-hM3Dq-mCherry virus. (C, D) Immunohistochemistry for (C) mCherry and (D) CNO-induced c-fos (DAB, black stain) in the ARC of virus-injected Vgatflox/flox (top), Rip-Cre (middle), and Rip-Cre, Vgatflox/flox (bottom) male mice. (E–G) Oxygen consumption over a 24-hour period (left panels) and during the first 4 hours (right panels) following i.p. injection of saline or CNO (n=8). *p<0.05, **p<0.01, ***p<0.001, paired t-tests compared to saline groups. (H–J) iBAT temperature over 4 hours following saline or CNO injection (n=6–8). *p<0.01, paired t-test compared to animals of the same genotype before CNO injection; #p<0.01, paired t-test compared to saline-injected animals at given time point. (K–M) Ucp1 mRNA in iBAT 6 hours after saline or CNO injection (n=4–6). *p<0.05, unpaired t-test compared with saline-injected animals of the same genotype. Data are presented as mean ± SEM. See also Figure S4.
Figure 6
Figure 6. Projection of ARC RIP-Cre Neurons
(A) Diagram of AAV-Flex-ChR2(H134R)-mCherry (left) and schematic indication of the stereotaxic injection into the ARC of Rip-Cre transgenic mice (right). (B) Representative voltage tracing showing light-driven spikes in a current-clamped arcuate neuron marked by mCherry fluorescence. Blue tickmarks represent 0.5msec light flashes at 0.5Hz. (C–E) Immunohistochemistry for mCherry in the hypothalamus of virus-injected Rip-Cre transgenic mice. mCherry-expressing RIP-Cre neurons in the ARC are shown in (C) and in a zoomed view in (D). (E) mCherry-expressing RIP-Cre neuron fibers in the PVH. DMH: dorsomedial hypothalamus; VMH: ventromedial hypothalamus; ME: median eminence; ARC: arcuate nucleus; SCN: suprachiasmatic nucleus; PVH: paraventricular hypothalamus; 3V: third ventricle; fx: fornix; opt: optic tract. (F) - i) Light-evoked IPSCs in a PVH neuron before (left) and after (right) the addition of 20μM bicuculine in response to clusters of light pulses. Blue tickmarks represent 0.5msec light flash at 0.5Hz. ii) Zoomed in view of response to a single pulse of light. See also Figure S6.
Figure 7
Figure 7. Downstream Neurocircuitry Engaged by ARC RIP-Cre Neurons
(A–D) (A) Diagram illustrating ChR2/retrobeads double-injection experiment in Rip-Cre transgenic mice. NTS: nucleus of the solitary tract. AAV-ChR2 = AAV-Flex-ChR2(H134R)-mCherry; Green Beads = fluorescent retrograde green beads. (B) Immunohistochemistry against mCherry (red) and native fluorescence of retrograde green beads (green) in the PVH. (C, D) Representative tracings of light-driven IPSCs recorded in (C) a PVH neuron with green beads (19 of 23), and in (D) an adjacent PVH neuron without green beads (13 of 14). (E–H) (E) Diagram illustrating ChR2/retrobeads double-injection experiment in Agrp-ires-Cre mice. (F) Immunostaining against mCherry (red) and native fluorescence of retrograde green beads (green) in the PVH. (G, H) Representative tracings of light-driven IPSCs recorded in (G) a PVH neuron with green beads (16 of 16), and in (H) an adjacent PVH neuron without green beads (2 of 9). (I–J) (I) Diagram illustrating retrograde tracing assay with green beads injected into the raphe pallidus (RPa) of Vgat-ires-Cre, lox-tdTomato mice. (J) Native fluorescence of green beads (green) and immunoreactivity of tdTomato (red) in the NTS. Arrows indicate the neurons labeled with both green beads (i.e. the neurons projecting to the RPa) and tdTomato (i.e. GABAergic neurons); two such neurons are zoomed in the dashed squares. (K–M) (K) Diagram illustrating AAV-Flex-ChR2(H134R)-mCherry virus injected into the NTS of Vgat-ires-Cre mice. (L) Representative voltage tracing showing light-driven spikes in a current-clamped NTS neuron marked by mCherry fluorescence. (M) Representative tracing of light-driven IPSCs recorded in RPa neurons (5 of 8). Blue tickmarks represent 0.5msec light flashes of 0.5Hz. See also Figure S7.

Comment in

References

    1. Alexander GM, Rogan SC, Abbas AI, Armbruster BN, Pei Y, Allen JA, Nonneman RJ, Hartmann J, Moy SS, Nicolelis MA, et al. Remote control of neuronal activity in transgenic mice expressing evolved G protein-coupled receptors. Neuron. 2009;63:27–39. - PMC - PubMed
    1. Andresen MC, Kunze DL. Nucleus tractus solitarius--gateway to neural circulatory control. Annu Rev Physiol. 1994;56:93–116. - PubMed
    1. Aponte Y, Atasoy D, Sternson SM. AGRP neurons are sufficient to orchestrate feeding behavior rapidly and without training. Nat Neurosci. 2011;14:351–355. - PMC - PubMed
    1. Atasoy D, Aponte Y, Su HH, Sternson SM. A FLEX switch targets Channelrhodopsin-2 to multiple cell types for imaging and long-range circuit mapping. J Neurosci. 2008;28:7025–7030. - PMC - PubMed
    1. Bachman ES, Dhillon H, Zhang CY, Cinti S, Bianco AC, Kobilka BK, Lowell BB. betaAR signaling required for diet-induced thermogenesis and obesity resistance. Science. 2002;297:843–845. - PubMed

Publication types

MeSH terms