

Use of caloric and noncaloric sweeteners in US consumer packaged foods, 2005-2009
- PMID: 23102182
- PMCID: PMC3490437
- DOI: 10.1016/j.jand.2012.07.009
Use of caloric and noncaloric sweeteners in US consumer packaged foods, 2005-2009
Abstract
Our understanding of the use of caloric and noncaloric sweeteners in the US food supply is limited. This study uses full ingredient list and Nutrition Facts label data from Gladson Nutrition Database and nationally representative purchases of consumer packaged foods from Nielsen Homescan in 2005 through 2009 to understand the use of caloric sweeteners (including fruit juice concentrate) and noncaloric sweeteners in consumer packaged foods. Of the 85,451 uniquely formulated foods purchased during 2005 through 2009, 75% contain sweeteners (68% with caloric sweetener only, 1% with noncaloric sweetener only, 6% with both caloric and noncaloric sweeteners). Caloric sweetener are in >95% of cakes/cookies/pies, granola/protein/energy bars, ready-to-eat cereals, sweet snacks, and sugar-sweetened beverages. Noncaloric sweetener are in >33% of yogurts and sport/energy drinks, 42% of waters (plain or flavored), and most dietetic sweetened beverages. Across unique products, corn syrup is the most commonly listed sweetener, followed by sorghum, cane sugar, high-fructose corn syrup, and fruit juice concentrate. Also, 77% of all calories purchased in the United States in 2005-2009 contained caloric sweeteners and 3% contained noncaloric sweeteners, and 73% of the volume of foods purchased contained caloric sweetener and 15% contained noncaloric sweetener. Trends during this period suggest a shift toward the purchase of noncaloric sweetener-containing products. Our study poses a challenge toward monitoring sweetener consumption in the United States by discussing the need and options available to improve measures of caloric sweetener and noncaloric sweetener and additional requirements on Nutrition Facts labels on consumer packaged foods.
Copyright © 2012 Academy of Nutrition and Dietetics. Published by Elsevier Inc. All rights reserved.
Figures
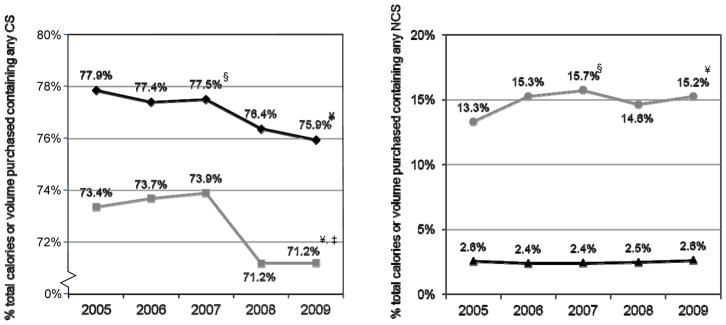
 % total calories purchased containing any CS (including FJC)
  % total volume purchased containing any CS (including FJC) b. Containing any Non-Caloric Sweeteners (NCS)
  % total calories purchased containing any NCS
  % total volume purchased containing any NCS Sources: Nielsen Homescan 2005-2009, Gladson Nutrition Database 2007 and 2010 § denotes statistical difference between 2005 and 2007 using two-tailed z-test (p<0.05) ¥ denotes statistical difference between 2005 and 2009 using two-tailed z-test (p<0.05) ‡ denotes statistical difference between 2007 and 2009 using two-tailed z-test (p<0.05)
References
-
- Fitch C, Keim KS. Position of the Academy of Nutrition and Dietetics: Use of nutritive and nonnutritive sweeteners. J Am Diet Assoc. 2012;112(5):739–758. - PubMed
-
- Popkin BM, Nielsen SJ. The sweetening of the world’s diet. Obesity. 2003;11(11):1325–1332. - PubMed
-
- U.S. Department of Agriculture. [Accessed May 1, 2012];Report of the Dietary Guidelines Advisory Committee on the Dietary Guidelines for Americans, 2010. 2010 http://www.cnpp.usda.gov/DGAs2010-DGACReport.htm.
-
- WHO/FAO. Technical Report Series. Vol. 916. Geneva: World Health Organization; 2003. Diet, Nutrition and the Prevention of Chronic Diseases. Report of a joint WHO/FAO expert consultation. - PubMed
-
- Lustig RH, Schmidt LA, Brindis CD. Public health: The toxic truth about sugar. Nature. 2012;482:27–29. - PubMed
Publication types
MeSH terms
Substances
Grants and funding
LinkOut - more resources
Full Text Sources
