. 2012 Nov:119:64-87.
doi: 10.1016/j.envres.2012.08.012. Epub 2012 Oct 26.

Mercury in Arctic marine ecosystems: sources, pathways and exposure

Affiliations

Mercury in Arctic marine ecosystems: sources, pathways and exposure

Jane L Kirk et al. Environ Res. 2012 Nov.

Abstract

Mercury in the Arctic is an important environmental and human health issue. The reliance of Northern Peoples on traditional foods, such as marine mammals, for subsistence means that they are particularly at risk from mercury exposure. The cycling of mercury in Arctic marine systems is reviewed here, with emphasis placed on the key sources, pathways and processes which regulate mercury levels in marine food webs and ultimately the exposure of human populations to this contaminant. While many knowledge gaps exist limiting our ability to make strong conclusions, it appears that the long-range transport of mercury from Asian emissions is an important source of atmospheric Hg to the Arctic and that mercury methylation resulting in monomethylmercury production (an organic form of mercury which is both toxic and bioaccumulated) in Arctic marine waters is the principal source of mercury incorporated into food webs. Mercury concentrations in biological organisms have increased since the onset of the industrial age and are controlled by a combination of abiotic factors (e.g., monomethylmercury supply), food web dynamics and structure, and animal behavior (e.g., habitat selection and feeding behavior). Finally, although some Northern Peoples have high mercury concentrations of mercury in their blood and hair, harvesting and consuming traditional foods have many nutritional, social, cultural and physical health benefits which must be considered in risk management and communication.


Figures

Figure 1
Figure 1
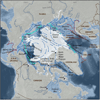
Map of the Arctic Ocean including major seas and ocean currents (arrows; warm currents = red, cold currents = black), as well as median sea ice extent between 1979–2000 (blue line), and minimum sea ice extent in 2010 (shaded area).
Figure 2
Figure 2
Locations where atmospheric Hg speciation measurements have been carried out across the circumpolar Arctic and concentrations of Hg(0) at some of these sites (from Steffen et al. 2008).
Figure 3
Figure 3
Average concentrations of THg (ng L−1) in snow (A) and melt water (B) as well as calculated average mean loss of Hg from surface snow within a 24 hr period (%) (C) at various Arctic locations (Data from Durnford and Dastoor 2011).
Figure 4
Figure 4
THg deposition (µg m−2yr−1; left) and surface air concentration of Hg(0) (ng m−3; right) simulated by the Global Regional Atmospheric Heavy Metals Model (GRAHM) for year 2005 (AMAP 2011).
Figure 5
Figure 5
Frequency of long-range transport episodes or intercontinental transport of Hg to the high Arctic (left) and subarctic (right) from different source regions (Data from Durnford et al. 2010).
Figure 6
Figure 6
DGM concentrations (pg L−1) measured in surface waters of the Canadian Arctic Archipelago, Hudson Strait, Hudson Bay (Kirk et al. 2008), along the coast of Greenland, along the Alaskan coast, across the Chukchi Sea and across the Arctic Ocean going from Barrow, Alaska to Spitsbergen measured in 2005 (Andersson et al. 2008).
Figure 7
Figure 7
Average concentrations of methylated Hg (includes both MeHg and DMHg) (A) and DMHg (B) at the surface, mid, and bottom of the water column in the Canadian Arctic Archipelago and Hudson Bay (HB) in 2005 (Kirk et al. 2008), at the chlorophyll a maximum and oxycline in the Canadian Arctic Archipelago and Beaufort Sea (BS) in 2007 (Lehnherr et al. 2011) and in surface water under ice in Resolute Passage, Nunavut in 2004 (St. Louis et al. 2007).
Figure 8
Figure 8
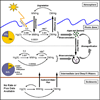
Conceptual diagram of processes affecting MeHg concentrations in the water column of the Arctic Ocean. The various Hg methylation and (photo)demethylation pathways (thin arrows), each governed by their respective rate constants (k, d−1; values displayed above the arrows) along with associated biogeochemical fluxes (thick arrows), such as air–water gas exchange of DMHg and remineralization of POC and MeHg bioaccumulation/biomagnification (block arrows) (Data from Lehnherr et al. 2011).
Figure 9
Figure 9
Concentrations of Hg and δ15N signatures in Beaufort Sea biota collected from coastal shelf, off shore pelagic, and benthic zones. Invertebrates collected include: calanus copepods collected from the coastal shelf (Cal SH), calunus copepods (Cal Pel) and hyperiid amphipods (Themisto libellula) from off shore pelagic zone, mixed zooplankton from near the coastline (Est Zoo), and mysids, gammarid amphipods (Anonyx spp.) and shrimp from benthic zones. Fish collected include: pacific herring, Arctic cisco, least cisco, rainbow smelt, and saffron cod from the coastal shelf, Arctic cod from the off shore pelagic zone, and flounder and sculpin from the benthic regions. Three groups of beluga whales which utilize different habitats and foraging areas are also shown: Beluga 1: shallow coastal areas; Beluga 2: along ice edges; and Beluga 3: deep off-shore waters (Date from Loseto et al. 2008).
Figure 10
Figure 10
THg concentrations in eggs of different marine birds breeding in the circumpolar Arctic. Colors indicate region (turquoise = Alaska, orange = Canadian Arctic, purple = Norway, Yellow = Russia); error bars show the maximum observed concentration and the vertical red dashed lines indicates the threshold range for reproductive effects reported in the literature (Modified from Dietz et al. 2011).
Figure 11
Figure 11
Historical trends of Hg concentrations in hard tissues of various Arctic animals, expressed as % of modern maximum annual average concentrations (Modified from Braune et al. 2011, data from Dietz et al. 2009).

References

    1. AMAP. Mercury in the Arctic. Oslo: Arctic Monitoring and Assessment Programme (AMAP); 2011. AMAP Assessment 2011.
    1. Andersson ME, Gårdfeldt K, Jutterström S. Air–sea exchange of volatile mercury in the North Atlantic Ocean. Mar. Chem. 2011;125:1–7.
    1. Andersson ME, Sommar J, Gardfelt K, Lindqvist O. Enhanced concentrations of dissolved gaseous mercury in the surface waters of the Arctic Ocean. Mar. Chem. 2008;110:190–194.
    1. Andersson ME, Gårdfeldt K, Wängberg I, Sprovieri F, Pirrone N, Lindqvist O. Seasonal and daily variation of mercury evasion at coastal and off shore sites from the Mediterranean Sea. Mar. Chem. 2007;104:214–226.
    1. Ariya P, Dastoor A, Amyot M, Schroeder W, Barrie L, Anlauf K, Raofie F, Ryzhkov A, Davignon D, Lalonde J, Steffen A. The Arctic: A sink for mercury. Tellus B. 2004;56:397–403.